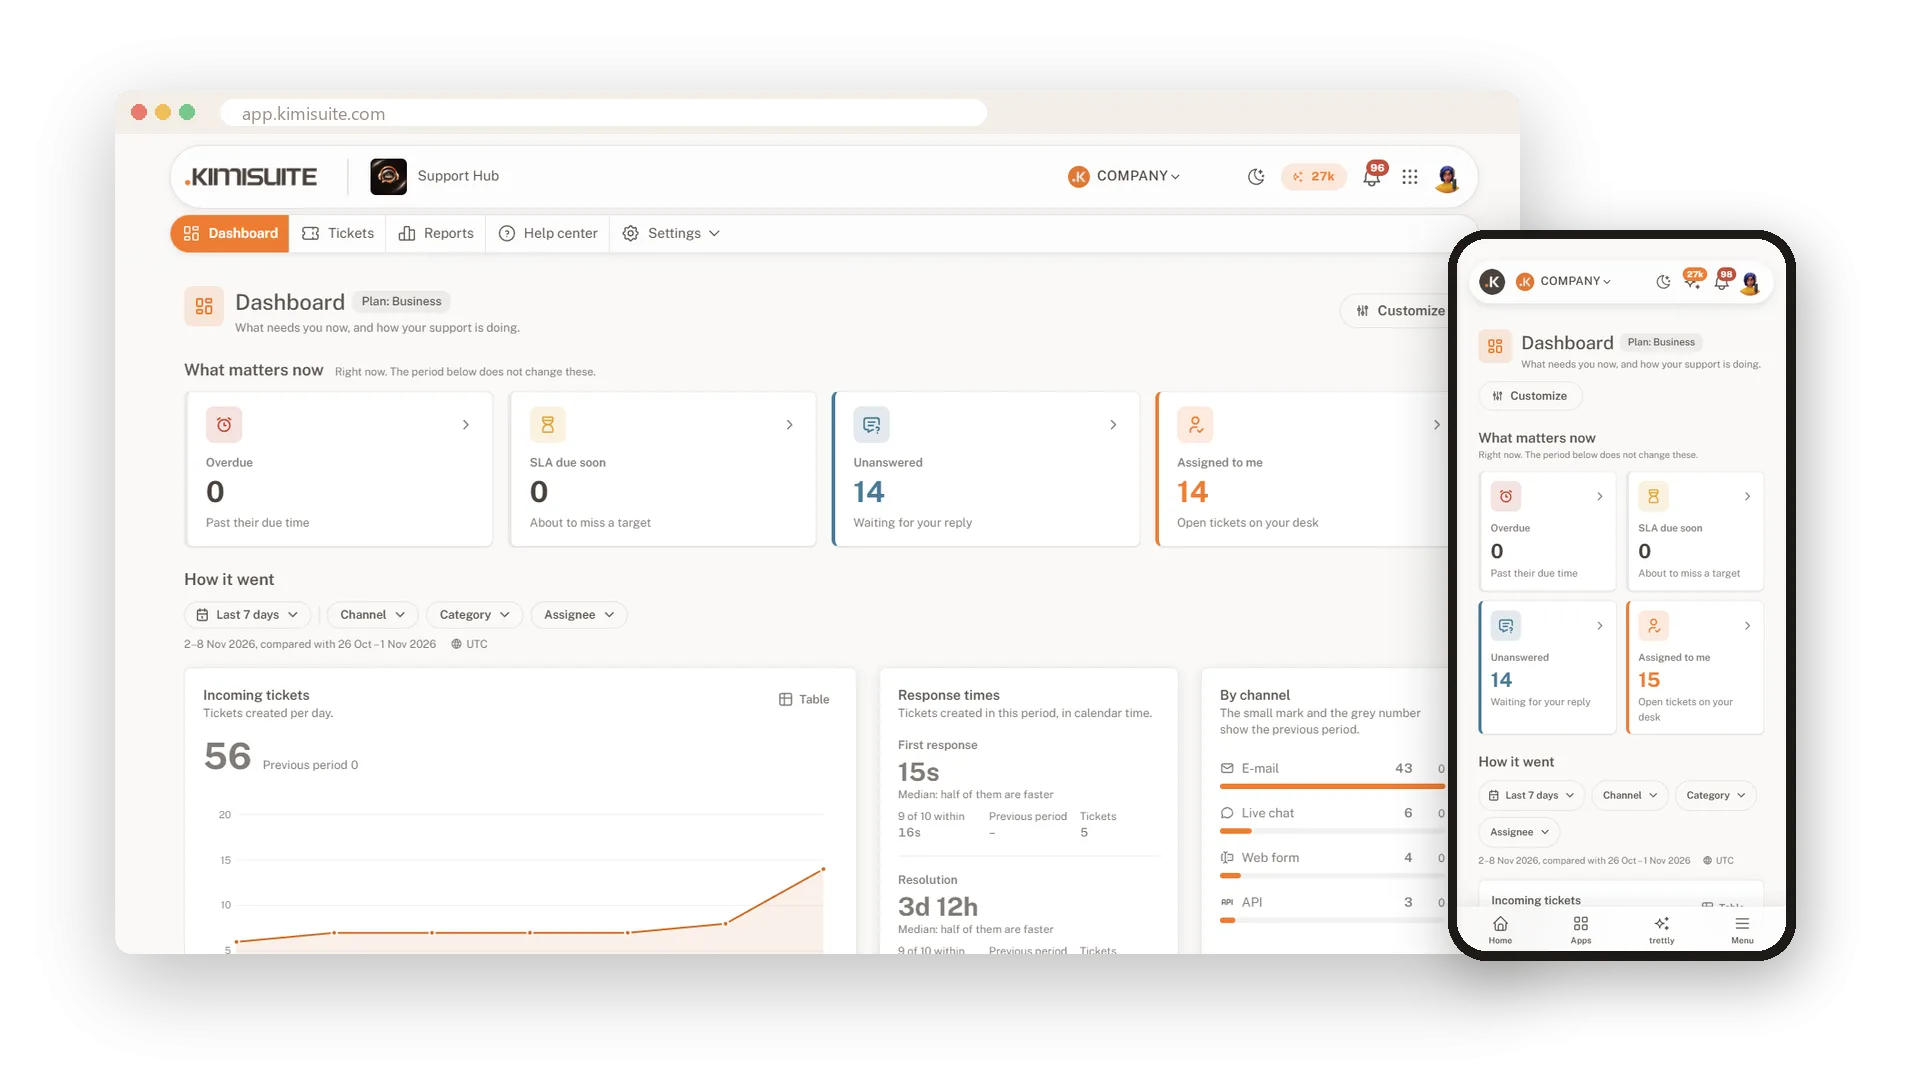
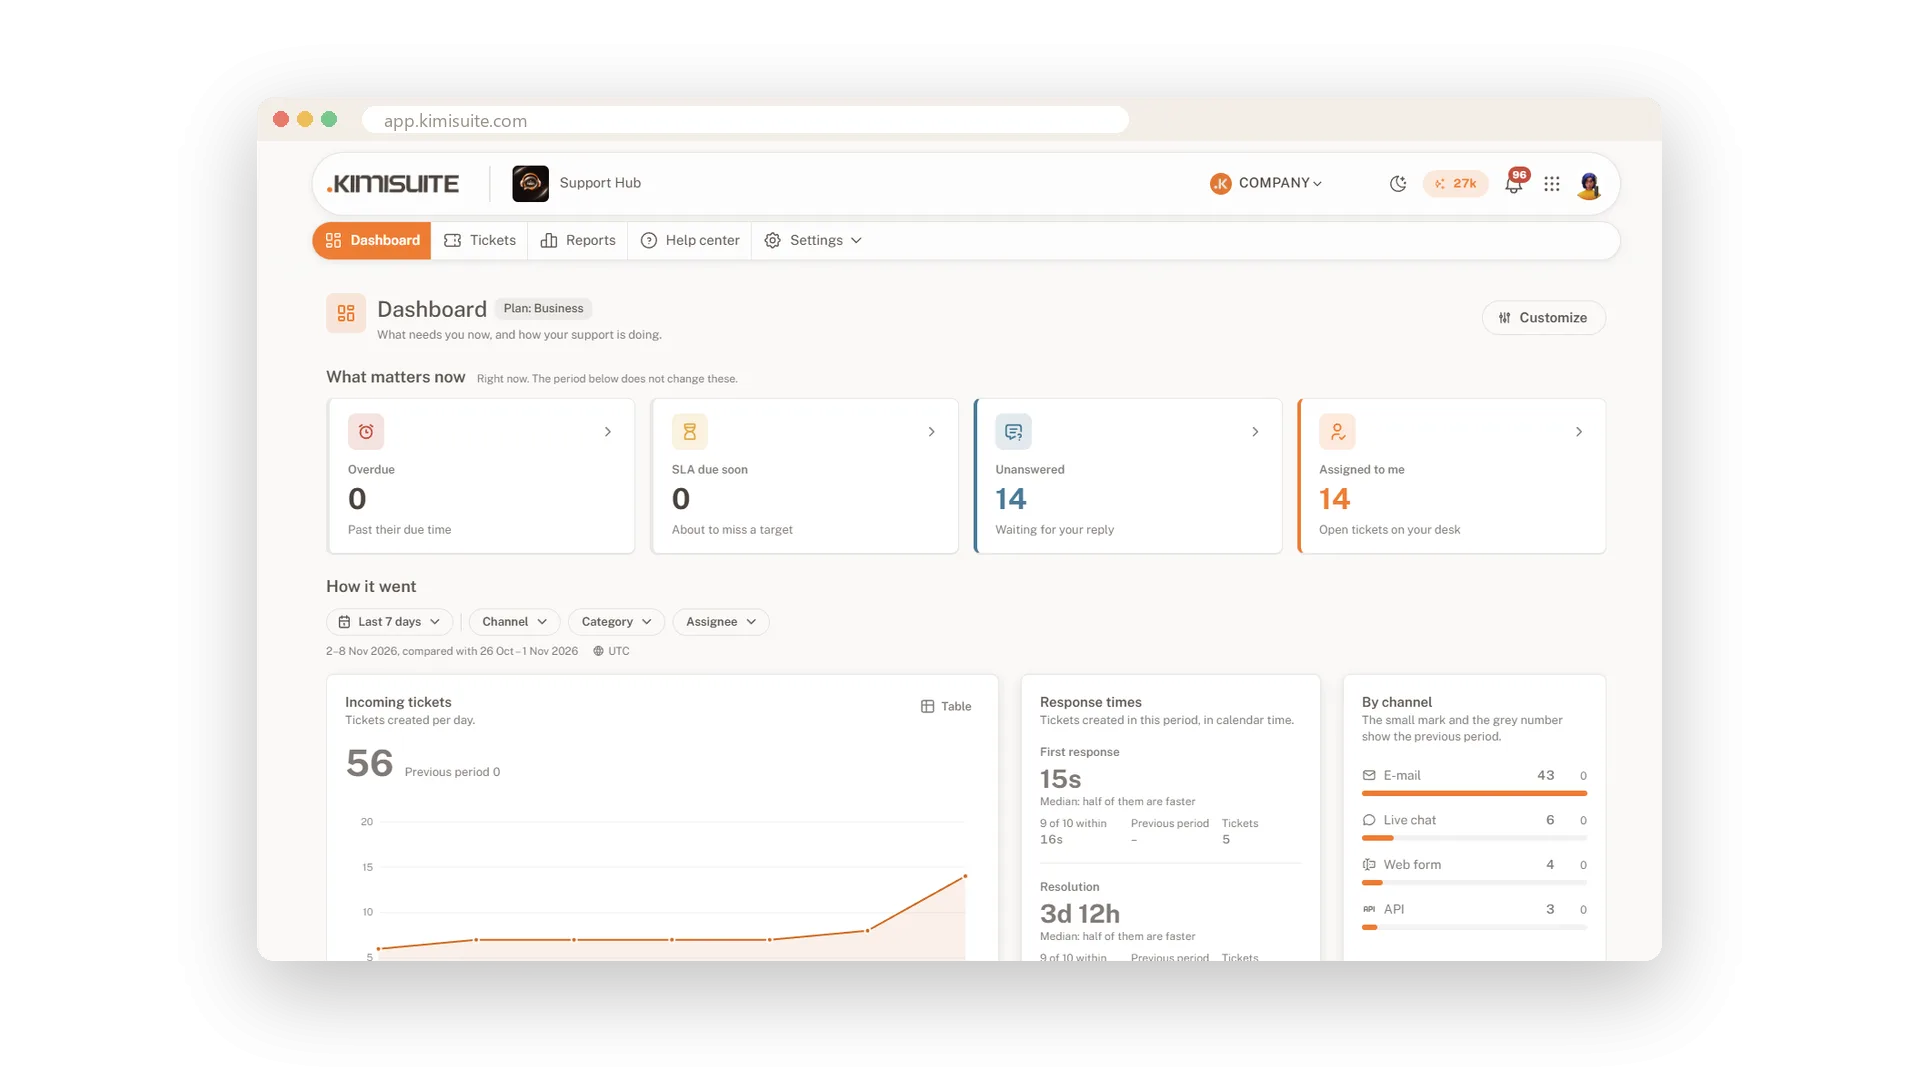
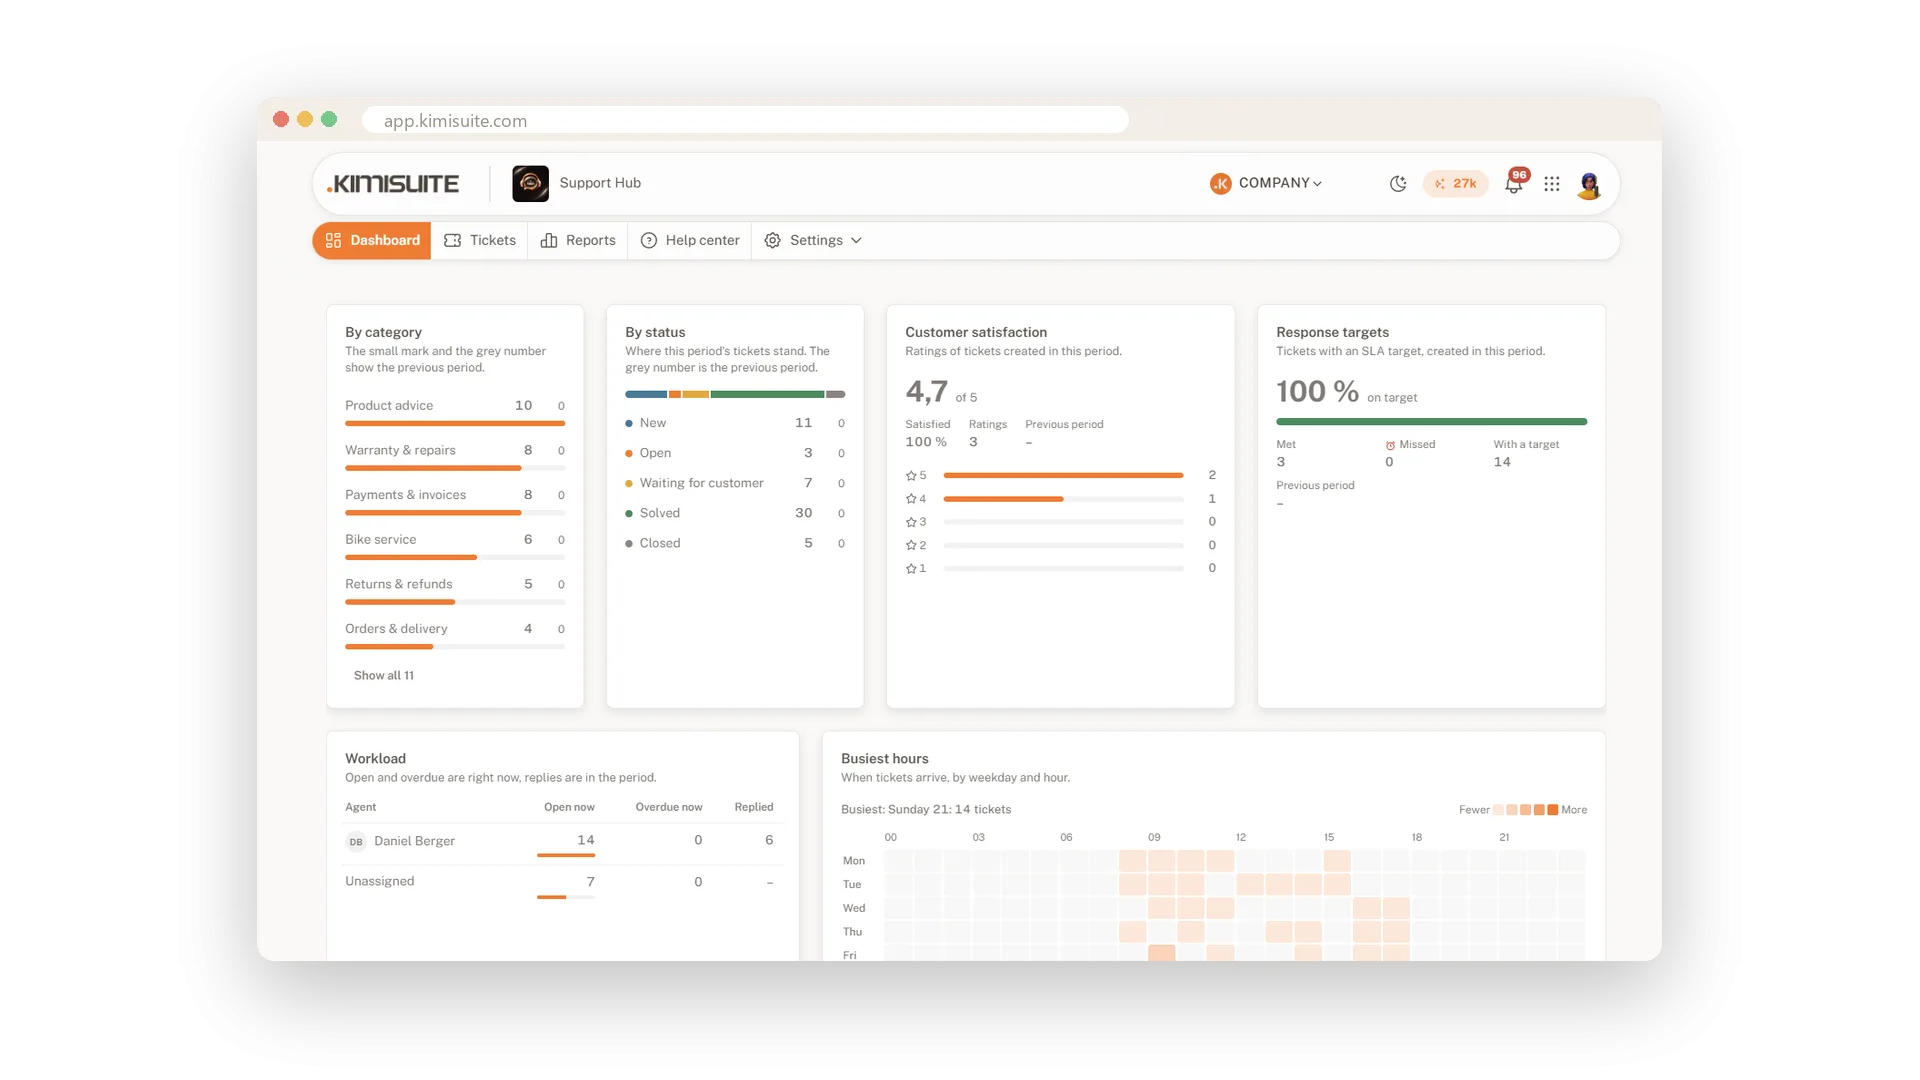
The dashboard opens with what matters now: overdue tickets, targets due soon, unanswered and yours. Below it you see the incoming volume per day, how fast your team answers and solves, which channels and categories are busy, and how satisfied your customers are. Every number opens the ticket list behind it.
Reports go deeper by agent, response target, category and help center article, with a CSV export of the ticket list. The satisfaction survey asks customers for a score after a ticket is solved, one click is enough, and a bad rating can start a rule.
Key Benefits
Start with what matters: overdue, due soon, unanswered and yours, always live
Numbers you can trust: every figure opens exactly the tickets behind it
Know how customers felt: a one-click score after each solved ticket
Spot spikes early: a hint when one topic suddenly brings many tickets
A dashboard that starts with today
What needs you now, then the trends
The top row shows overdue, due soon, unanswered and your tickets, always live. Choose a period and filters for the rest, and the page remembers them for you.
Reports by agent, target and topic
With a CSV export of the ticket list
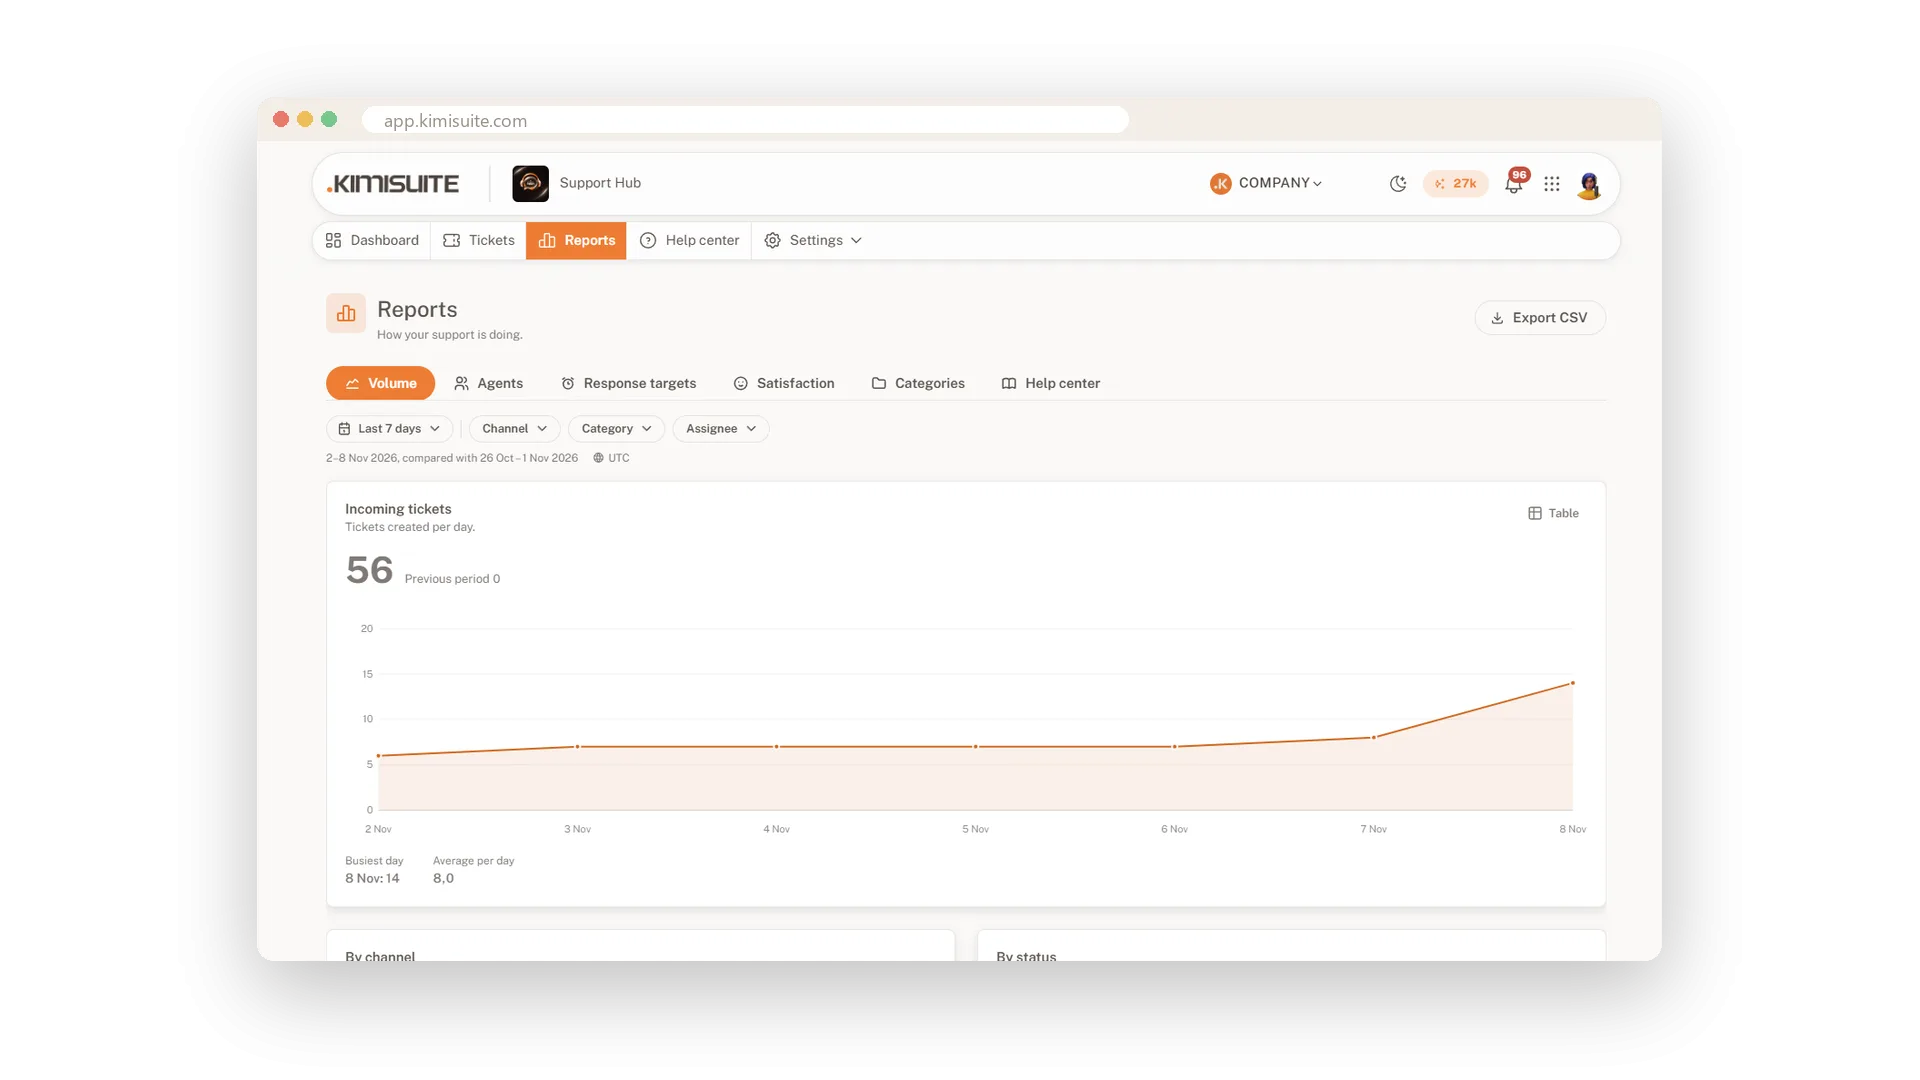
See response targets met, satisfaction, workload per agent, categories and how your help articles perform. Export the ticket list as CSV with the same filters for your own analysis.
A satisfaction survey with one click
Five numbers, a comment, a clear picture
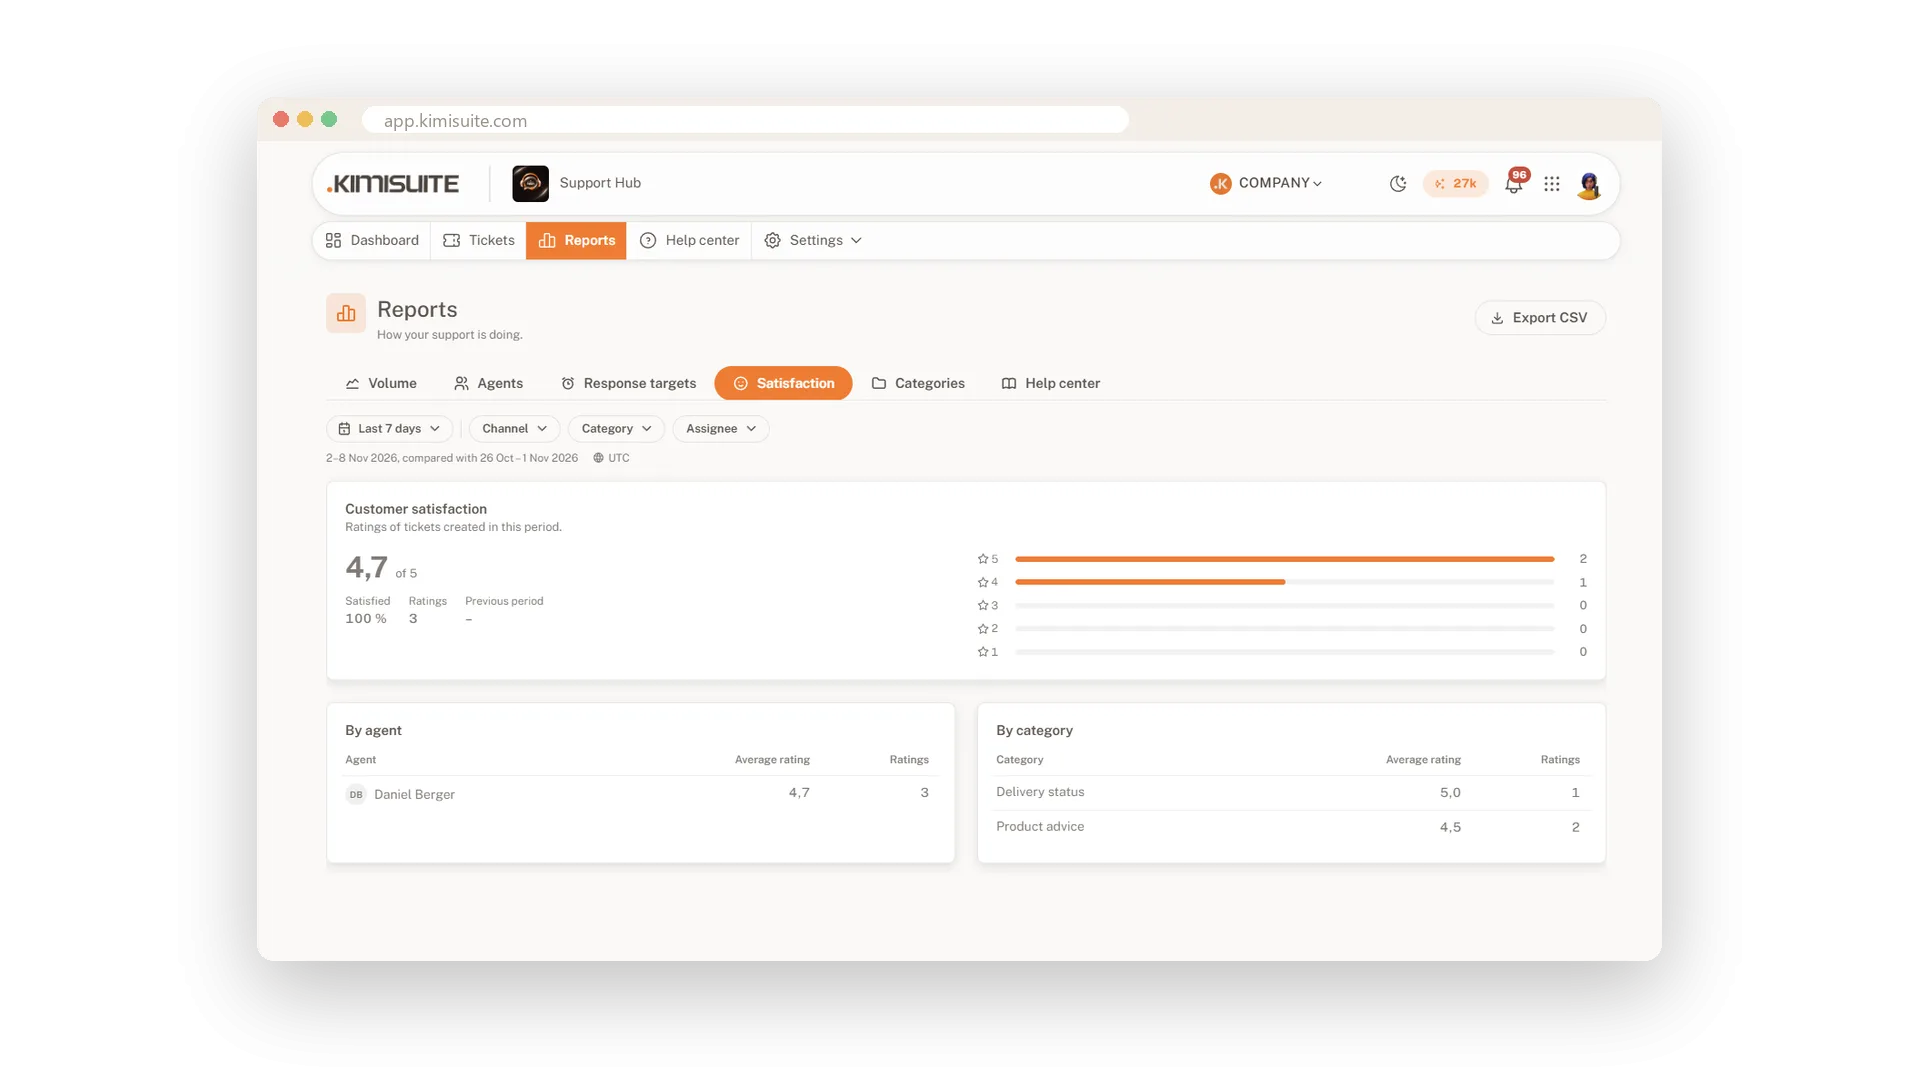
After a ticket is solved, customers get a short e-mail with five numbers. One click is enough, a comment is optional, and the Ratings tab shows your average, the response rate and every comment.
Dashboards arranged your way
Show, hide and reorder, save as layouts
Show the cards you need, hide the rest and put them in your order. Save layouts under a name, one for the daily check and one for the monthly review.
Use Cases
A busy Monday
The dashboard shows 14 tickets about login today, against two on a normal day. You open them in one click and answer each with the same canned reply.
The weekly team meeting
You compare this week with the last: first response times, solved tickets and the workload per person.
A bad rating
A customer gives a 2. A rule assigns the ticket to the team lead, who calls the customer the same day.
FAQ

Try Support Hub today
One shared inbox for e-mail, chat and Telegram
14 days free, cancel anytime, no minimum term.