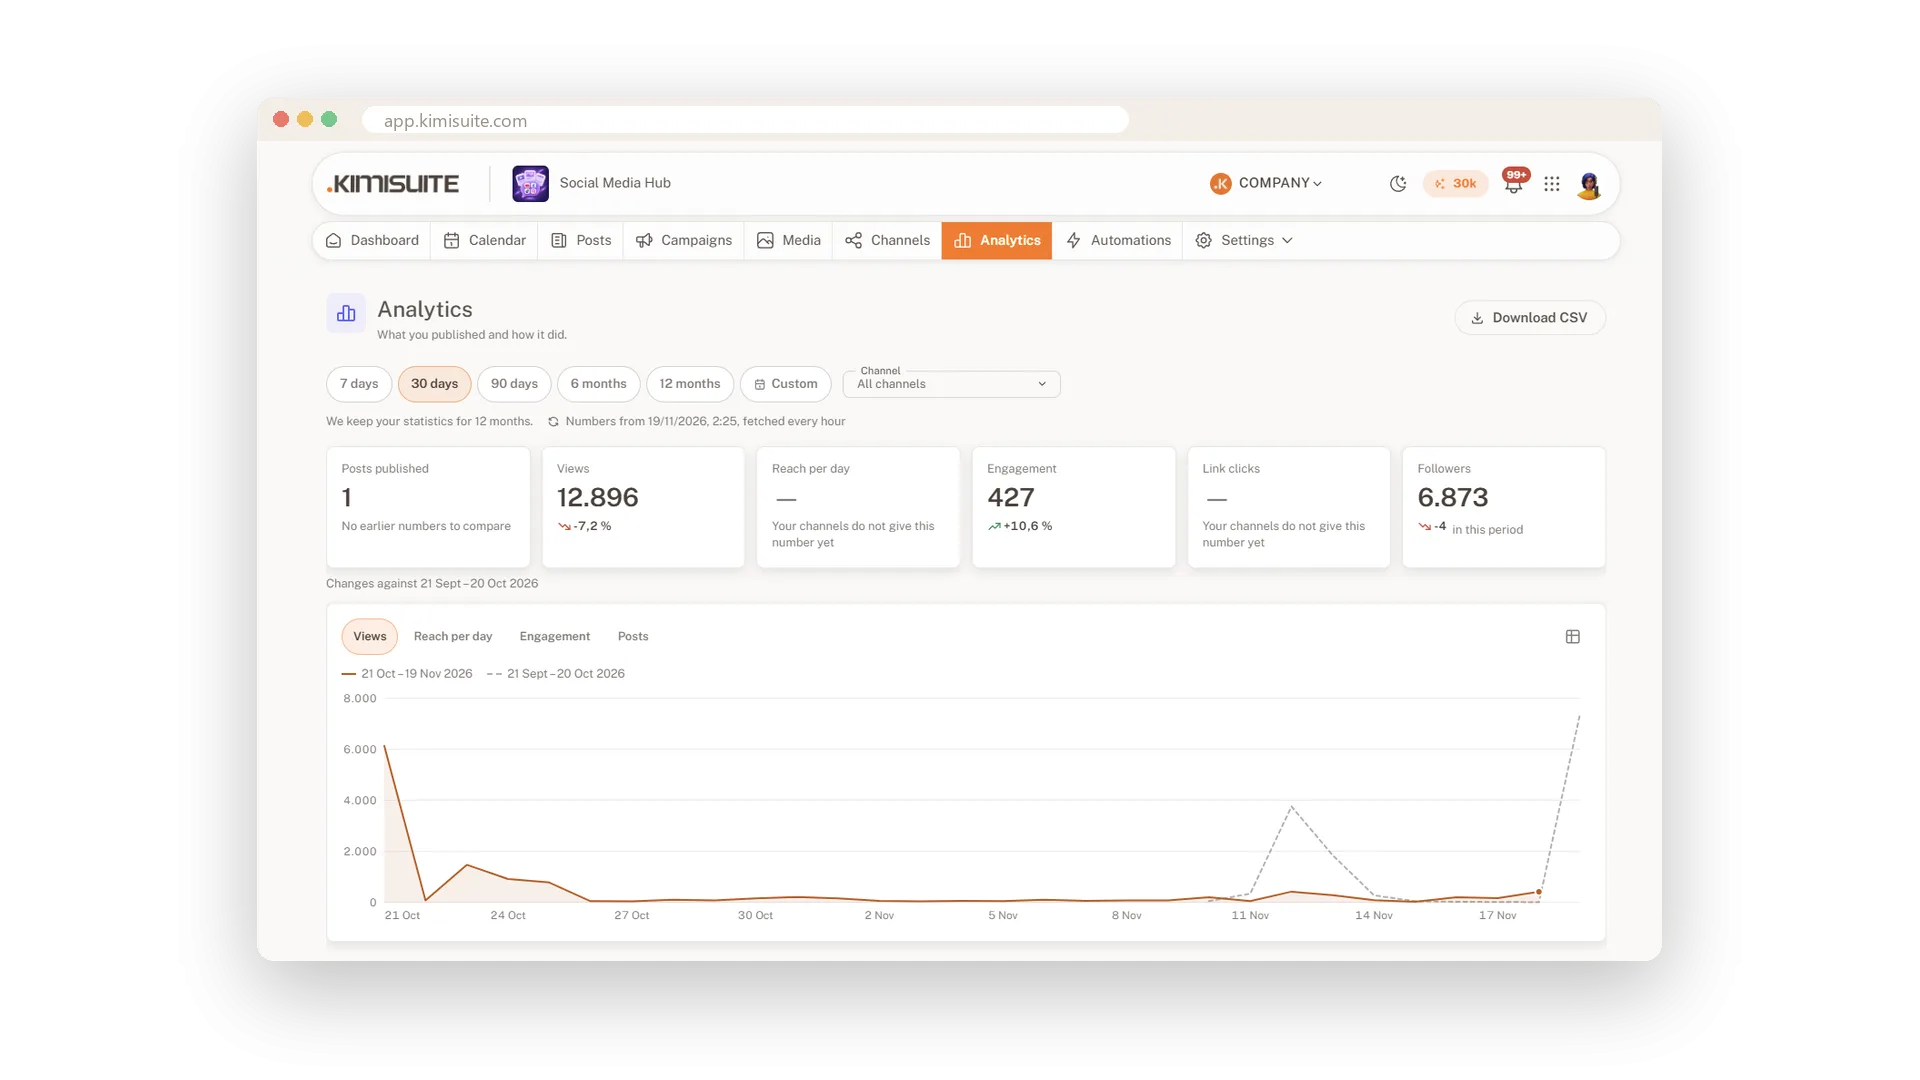
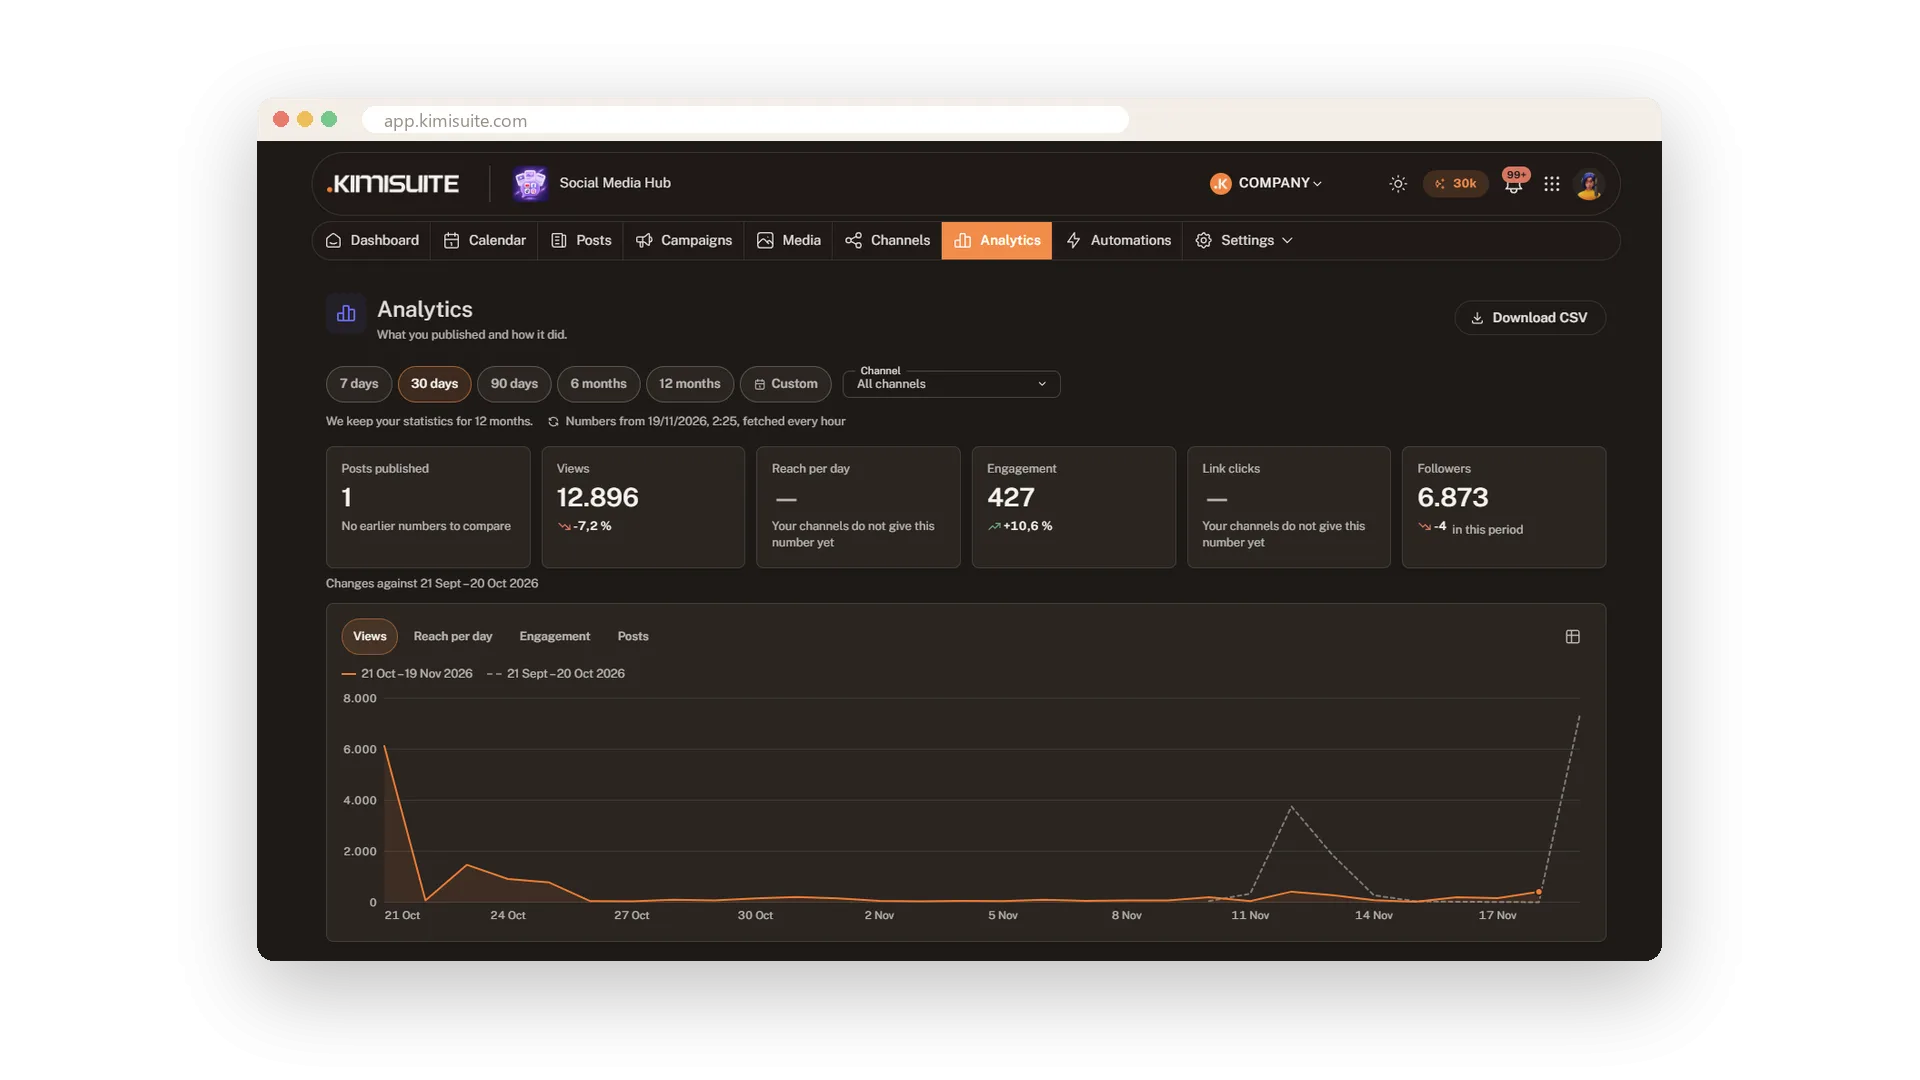
Did last month's posts reach anyone? The analytics page answers it on one screen: posts published, views, engagement, link clicks and followers, each compared with the period before. A chart shows the trend, and the best posts show what your audience liked.
The numbers come straight from the networks and are fetched every hour. Look at 7, 30 or 90 days, 6 or 12 months or your own period, per channel or all together, and download everything as CSV. Where a network does not give a number, you see a dash instead of a misleading zero.
Key Benefits
One screen: views, engagement, link clicks and followers for all channels
Honest comparison: every number against the same period before
Growth per channel: follower curves for every account
Yours to keep: download days, posts and channels as CSV
Key numbers with a comparison
See at once what went up and what went down
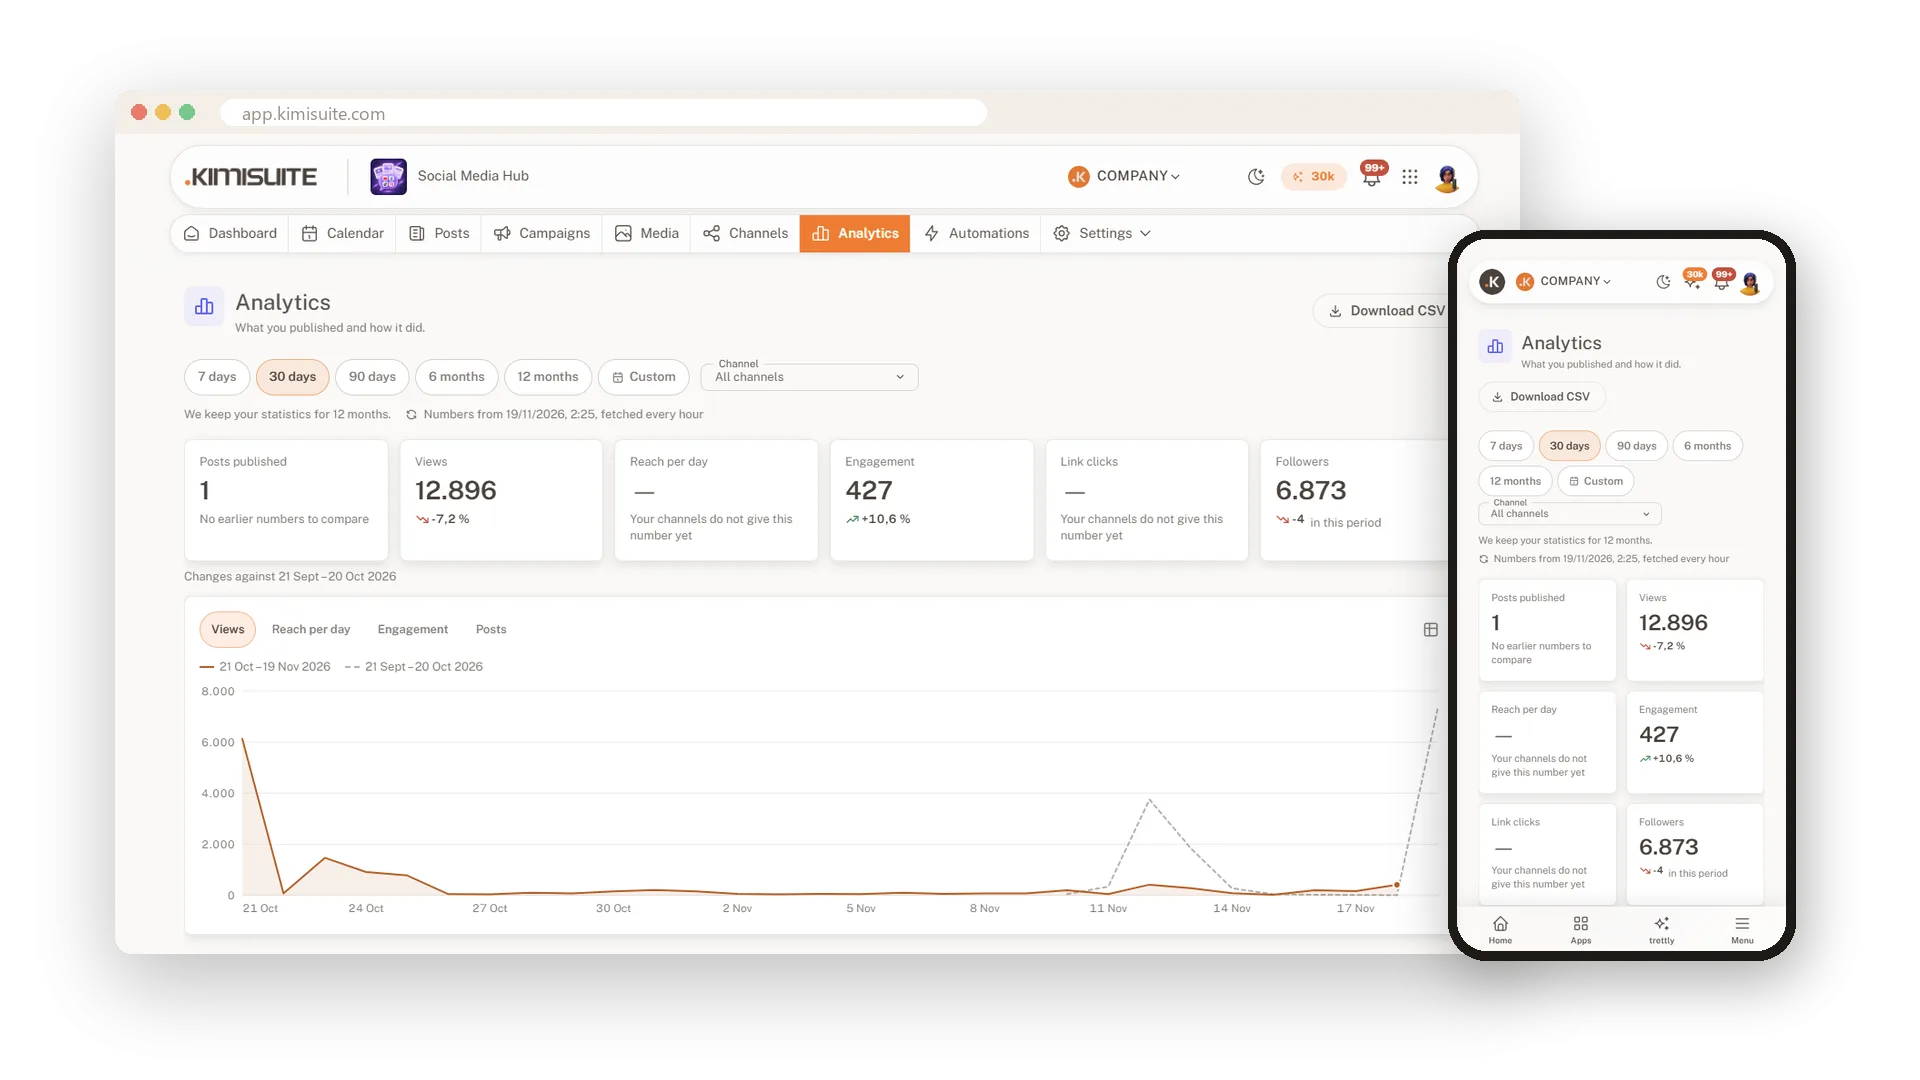
Views, engagement and followers sit at the top, each with the change against the period before. The chart shows both periods, on your desktop and on your phone.
Growth for every channel
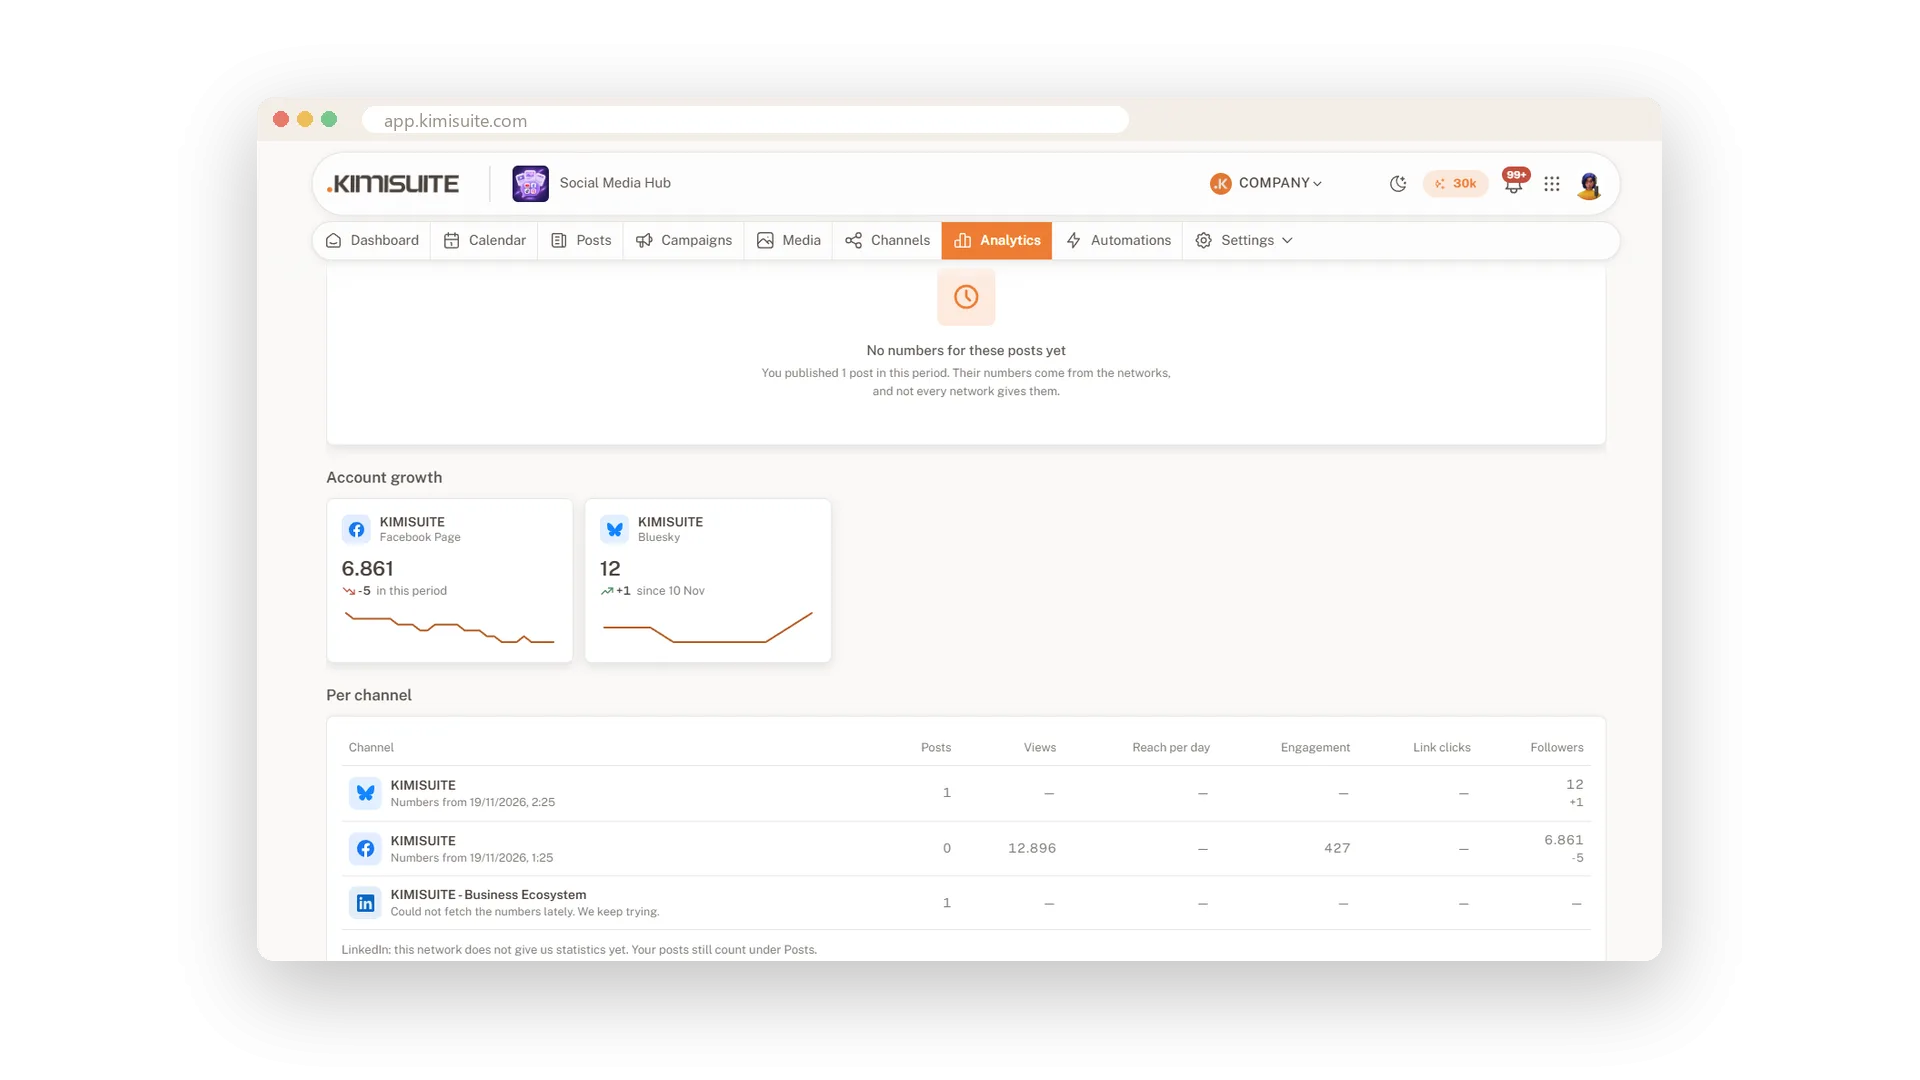
Follower curves and numbers per account
See how each account grows, with its own curve, and compare channels in one table: posts, views, engagement, clicks and followers side by side.
Export for your reports
Days, posts and channels as CSV
Download the numbers of any period as CSV, per day, per post or per channel, and use them in your own report or spreadsheet.
Use Cases
The monthly look back
On the first of the month you open 30 days, see that engagement grew and download the CSV for your report.
Which post worked?
The best posts list shows that the photo of your new terrace beat every offer. Next week you post more pictures of the place.
A client report
You choose one client's channel and the last quarter, and the numbers are ready for the meeting.
FAQ

Try Social Media Hub today
Plan, write and publish to every social network
Free of charge, in your own workspace, ready in a minute.