 Part of CRM Business Hub
 Reports that answer your questions
22 reports, a dashboard and a builder for your own
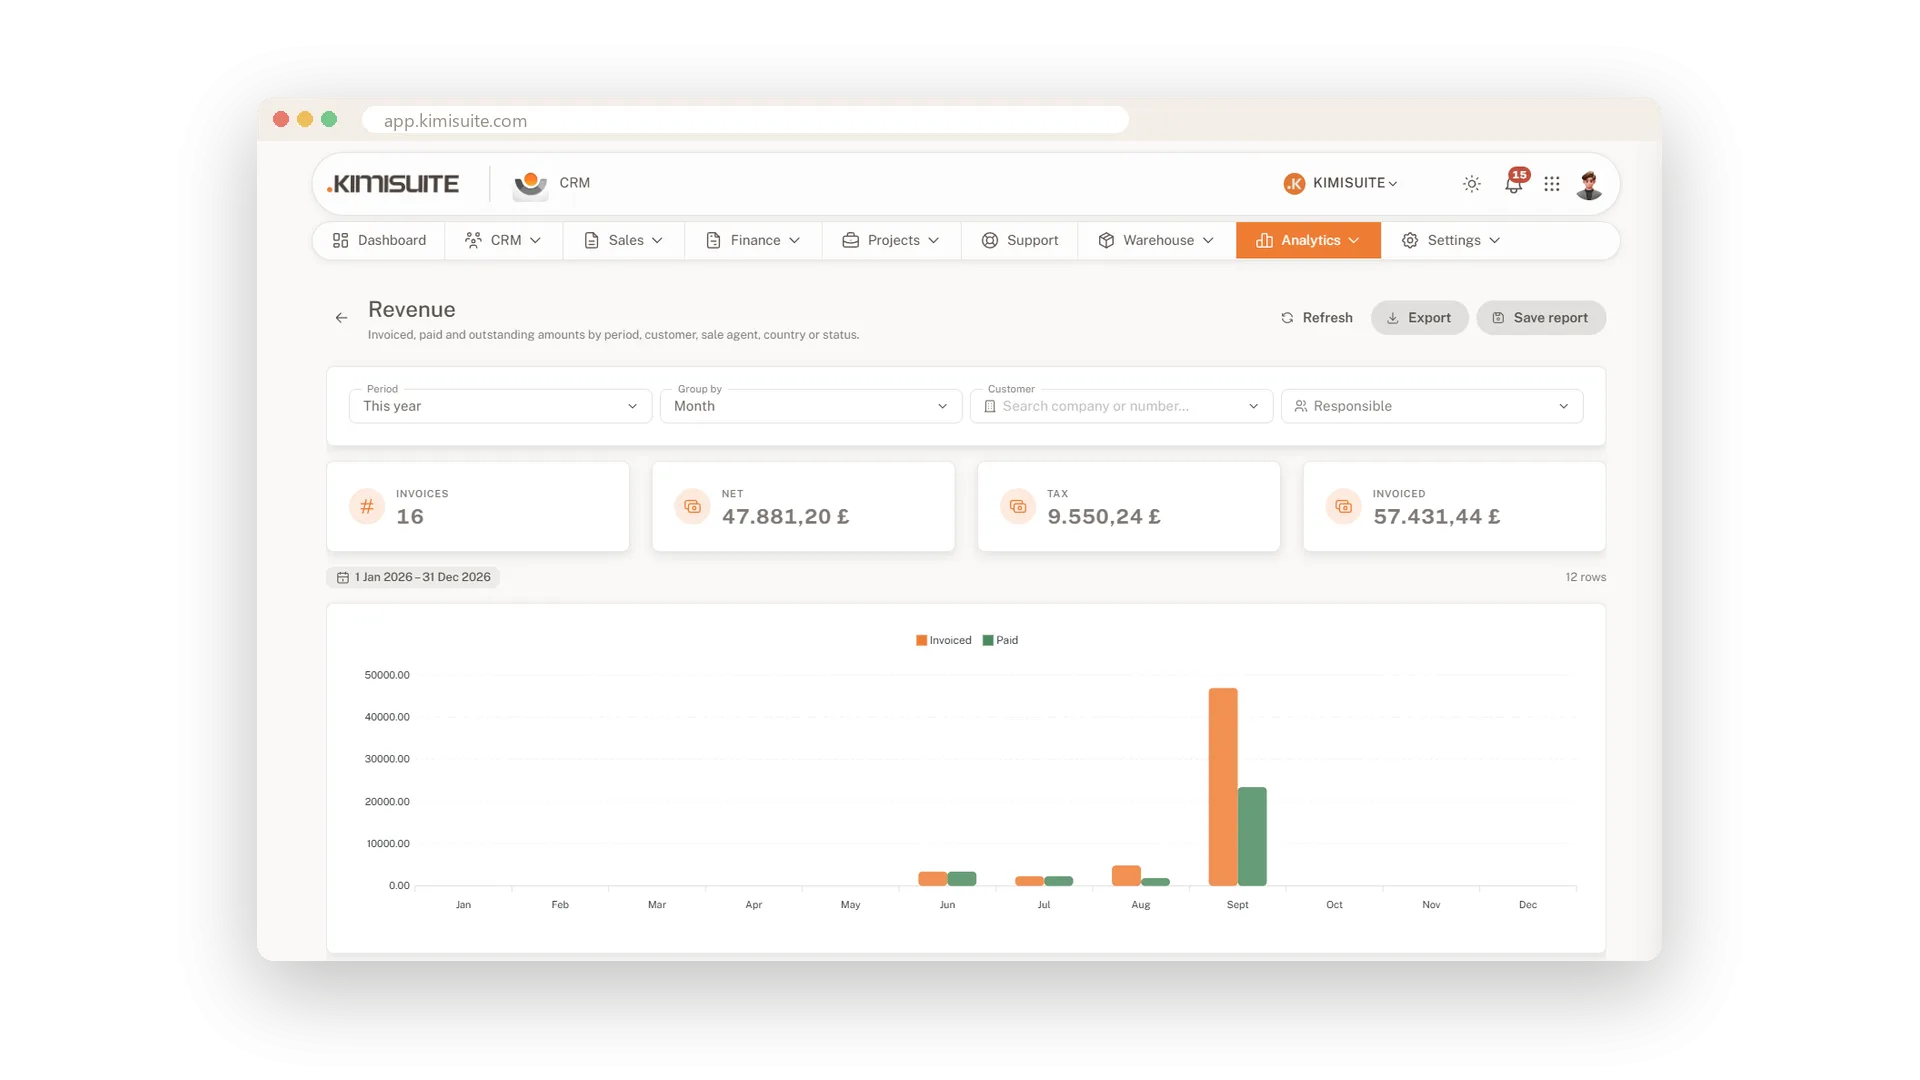
How much did you invoice this quarter? Who still owes you money, and since when? Which channels bring your leads? The CRM Business Hub answers from the data your team already enters every day - no spreadsheet, no extra tool. Open the dashboard in the morning and you see what needs attention before anyone asks.
Choose from 22 ready reports on revenue, payments, taxes, receivables, proposals, contracts, expenses, stock, projects and more. Set the period, group and filter the figures, and read the chart with the table beneath it. Save the views you use most, or export them. From Business, the report builder lets you put together your own reports and receive them by e-mail on a schedule.
Key Benefits
22 ready reports, each with period, grouping, filters, a chart and the table
A dashboard you arrange yourself: payments, funnel, forecast and what needs attention
Receivables aging shows who owes you what, and for how long
Ask your reports a question in plain words, answered with your workspace AI credits
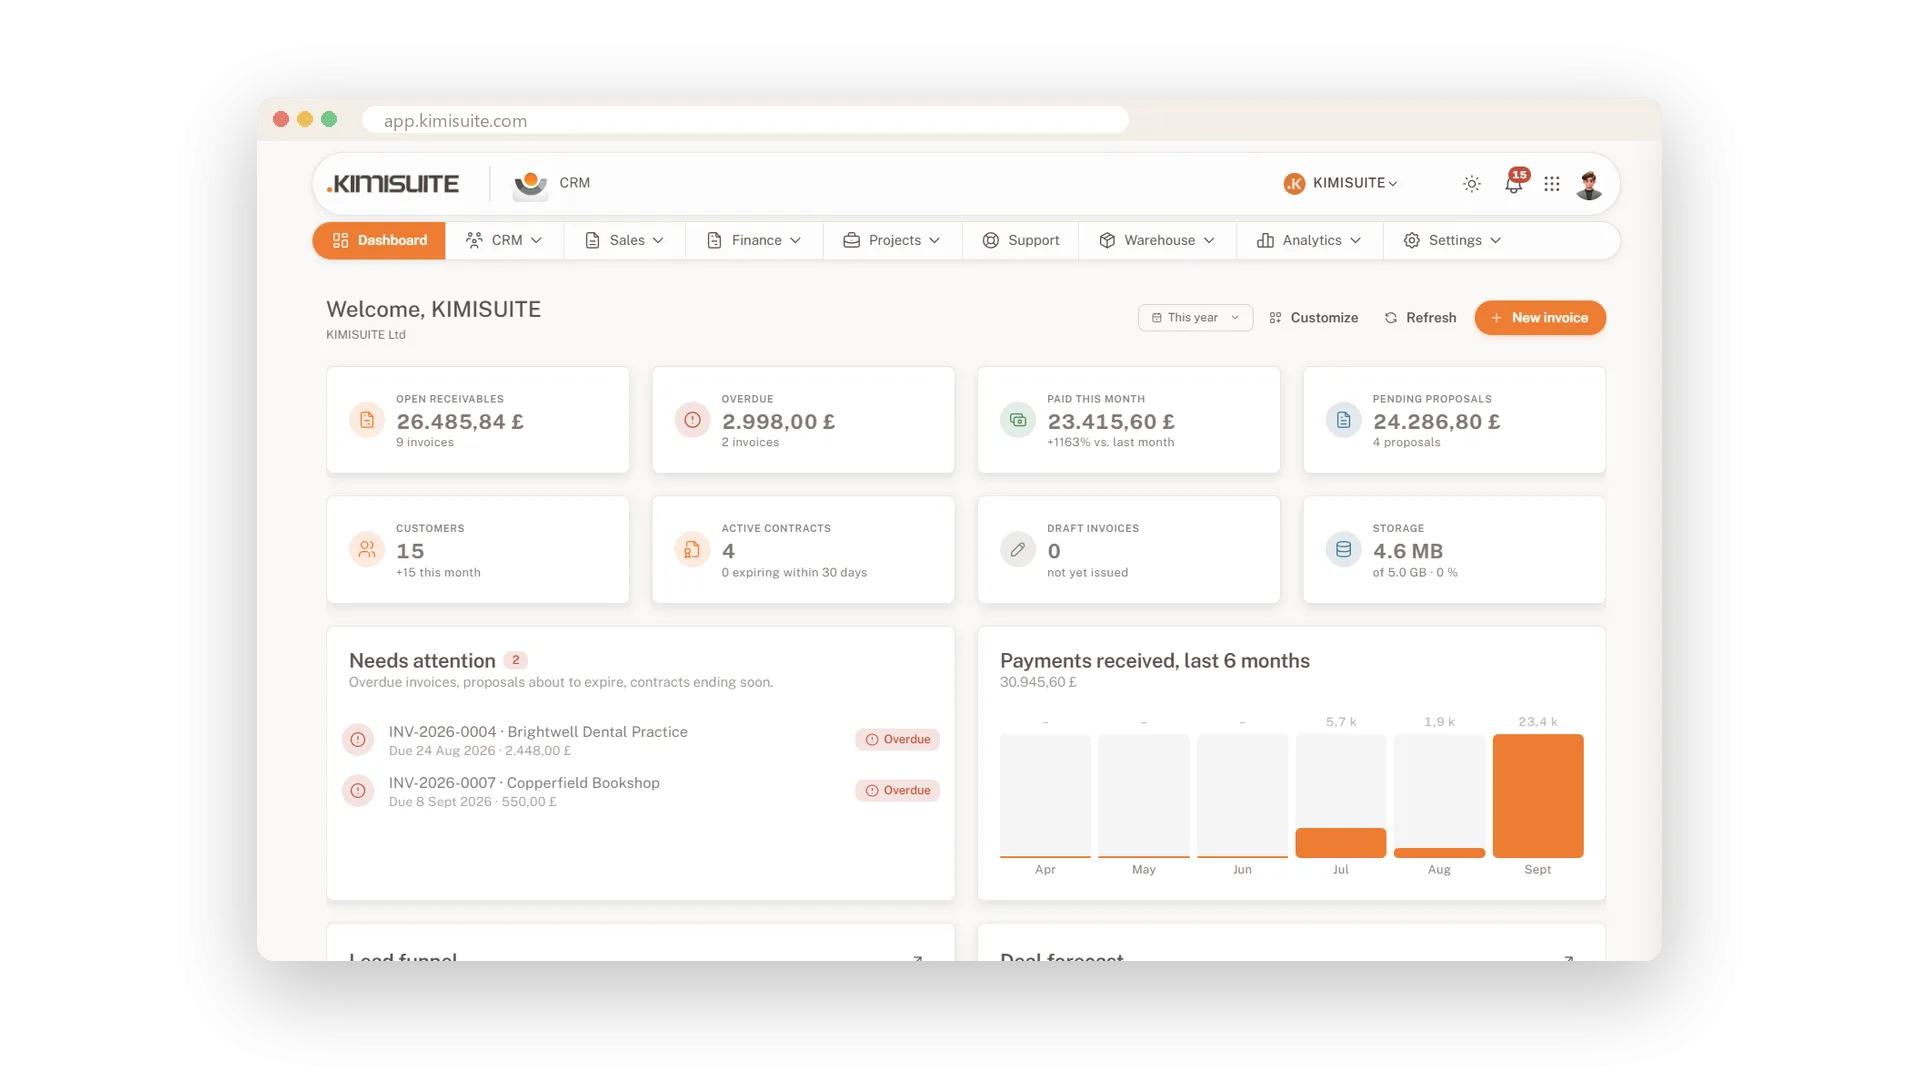
A dashboard you arrange yourself
What needs attention, before anyone asks
KPI tiles, a Needs attention list, six months of incoming payments, the lead funnel, the deal forecast and your most recent invoices, proposals and payments share one screen. Click Customize and keep only the widgets you really use.
Who owes you what, and how long
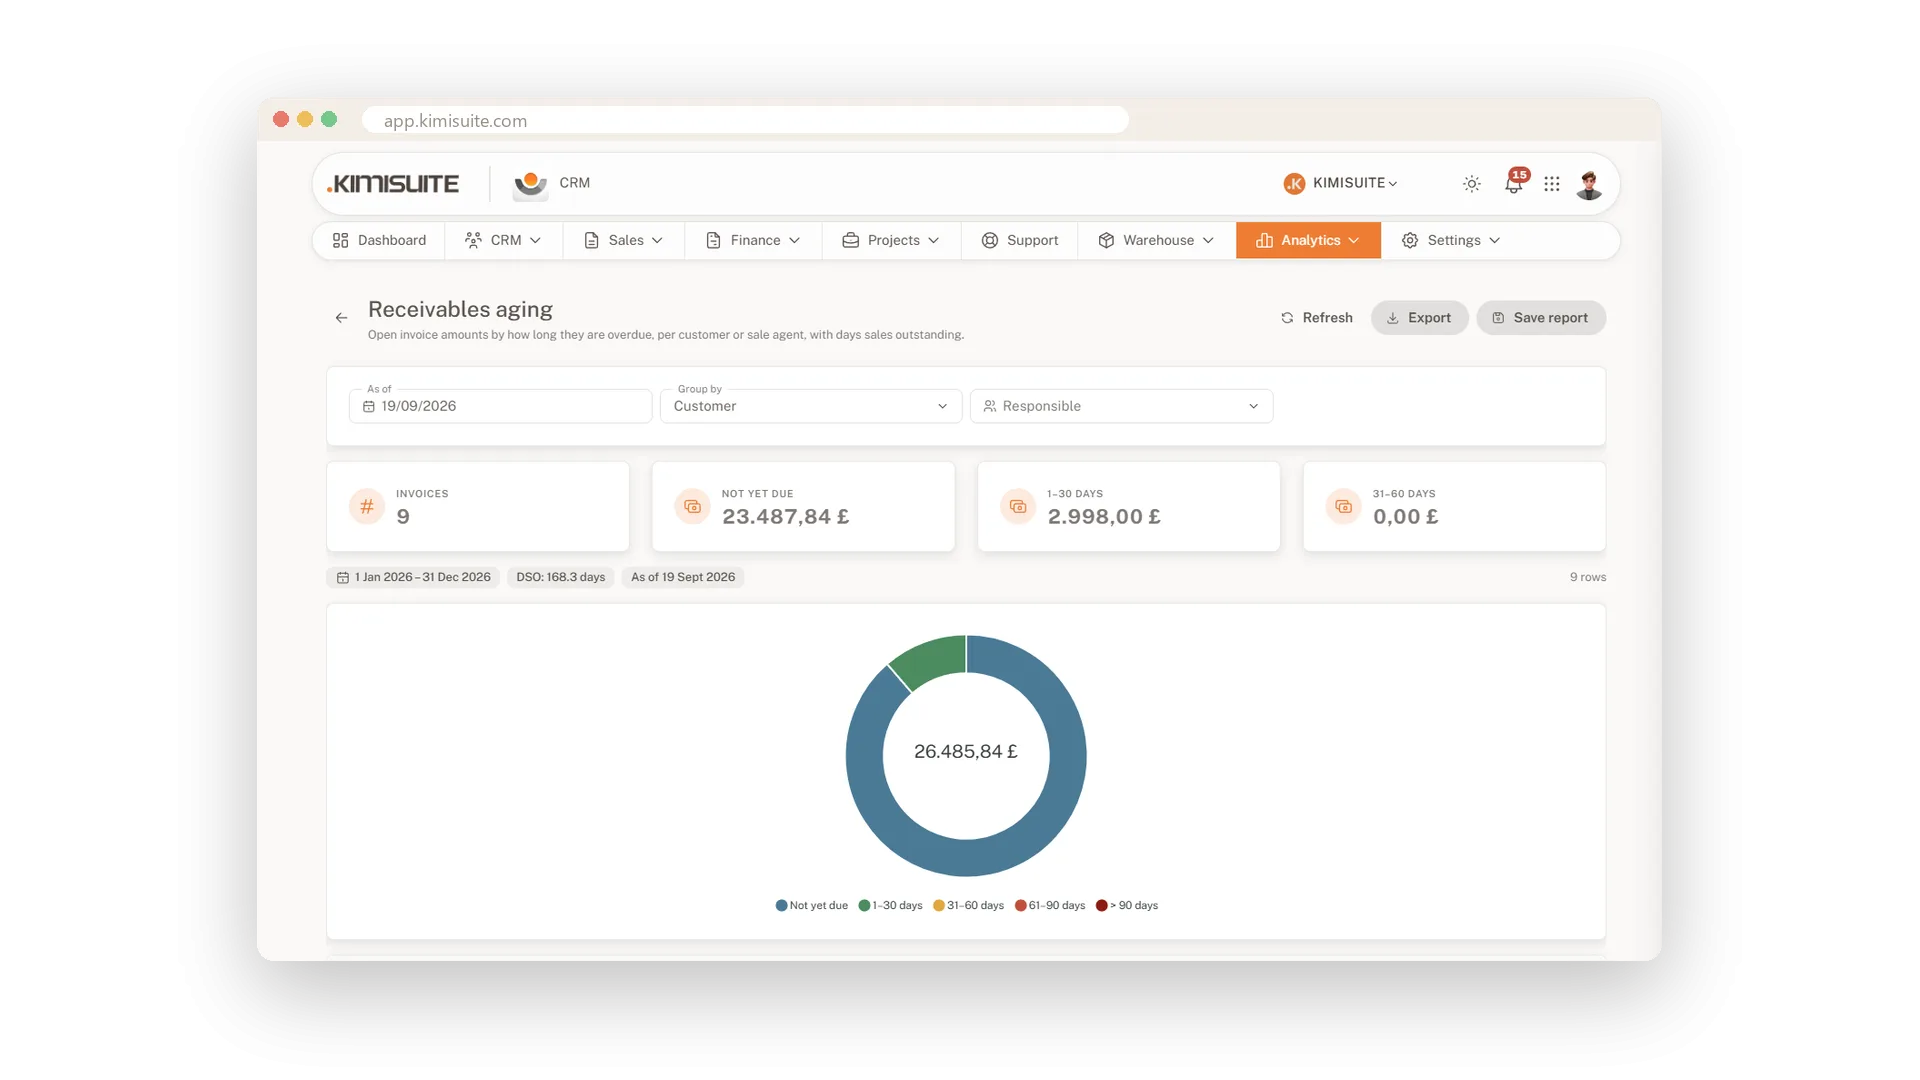
Open invoices sorted by how long they wait
The receivables aging report sorts your open amounts by how long they have been waiting. You see at a glance where a friendly reminder is enough and where a phone call is due. Its twin for supplier bills shows the other side: what you owe your suppliers.
Build and schedule your own reports
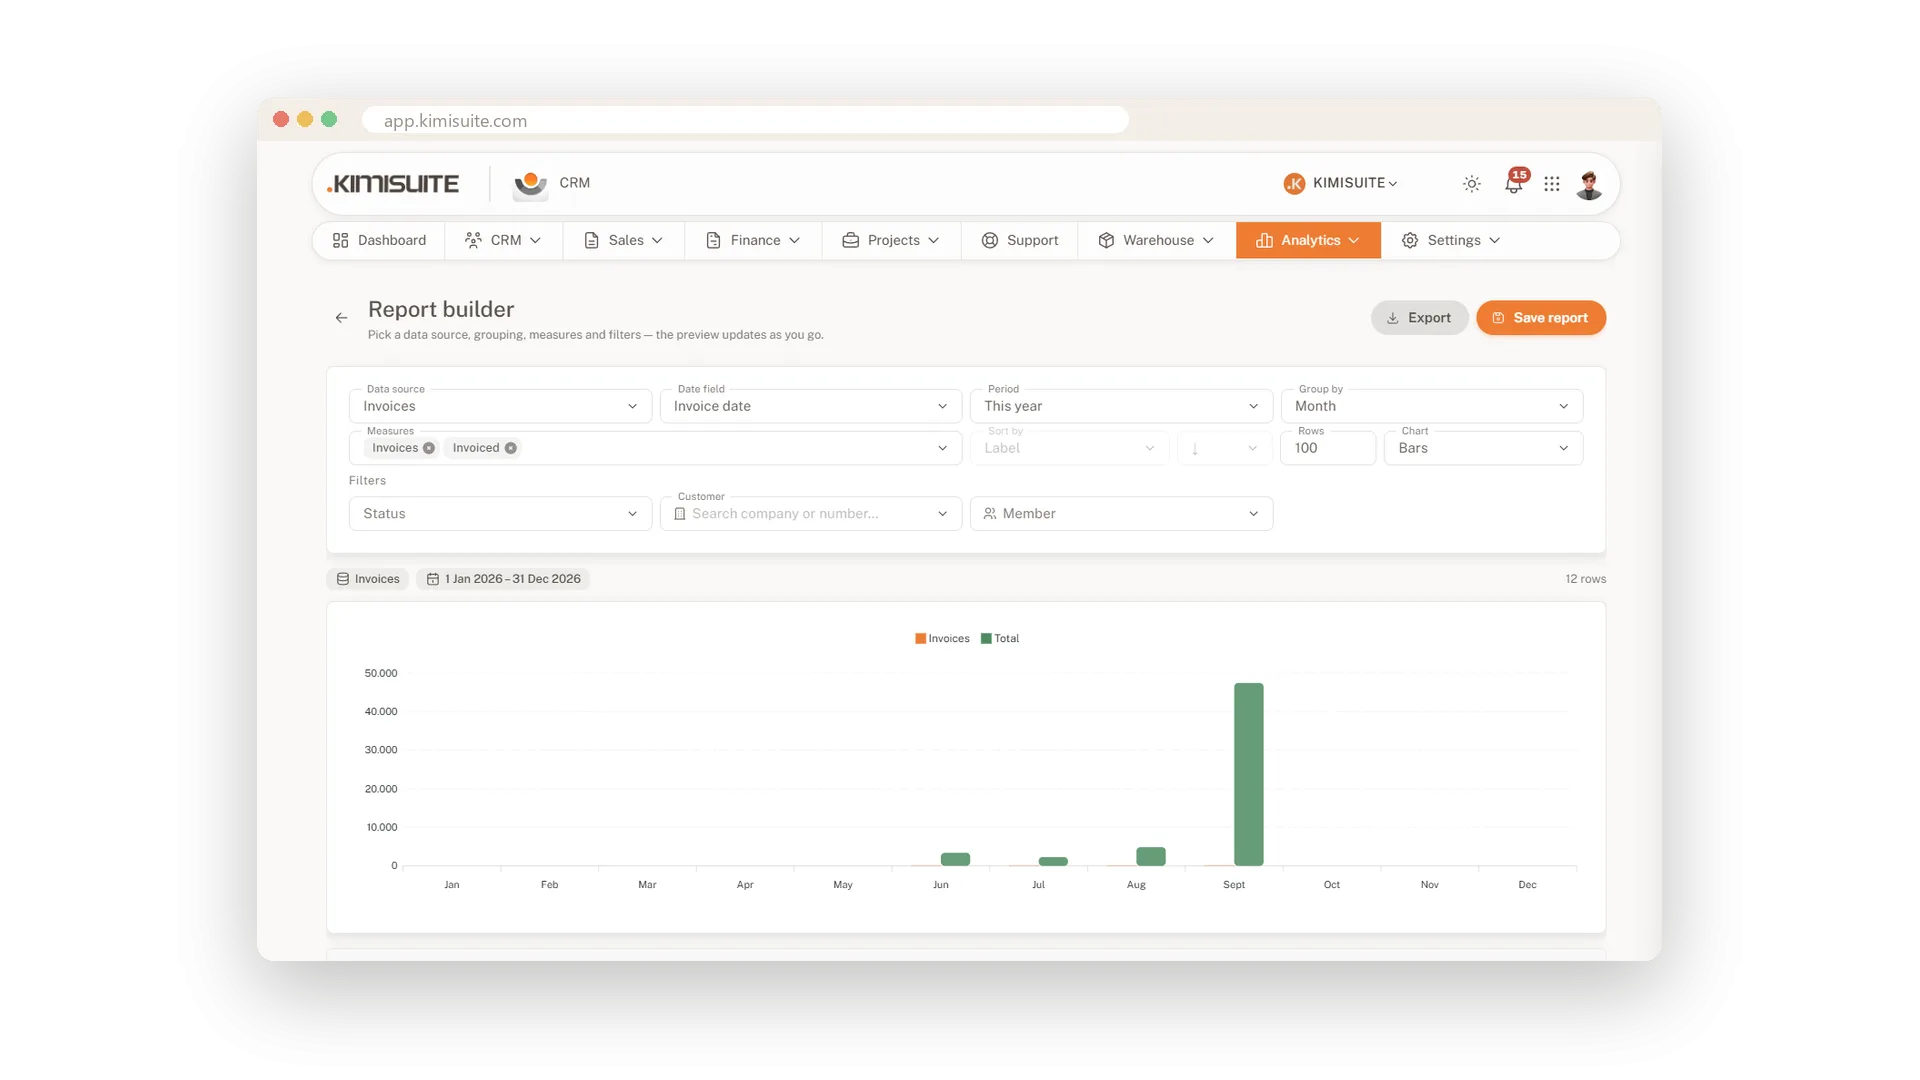
Your figures, your way, straight to your inbox
Pick a data source, a date field and a period, then choose how to group, what to measure and what to filter. The live preview shows the result while you build. Save it, or schedule it to arrive by e-mail - included from Business.
Lead funnel and pipeline reports
From first contact to won deal, in numbers
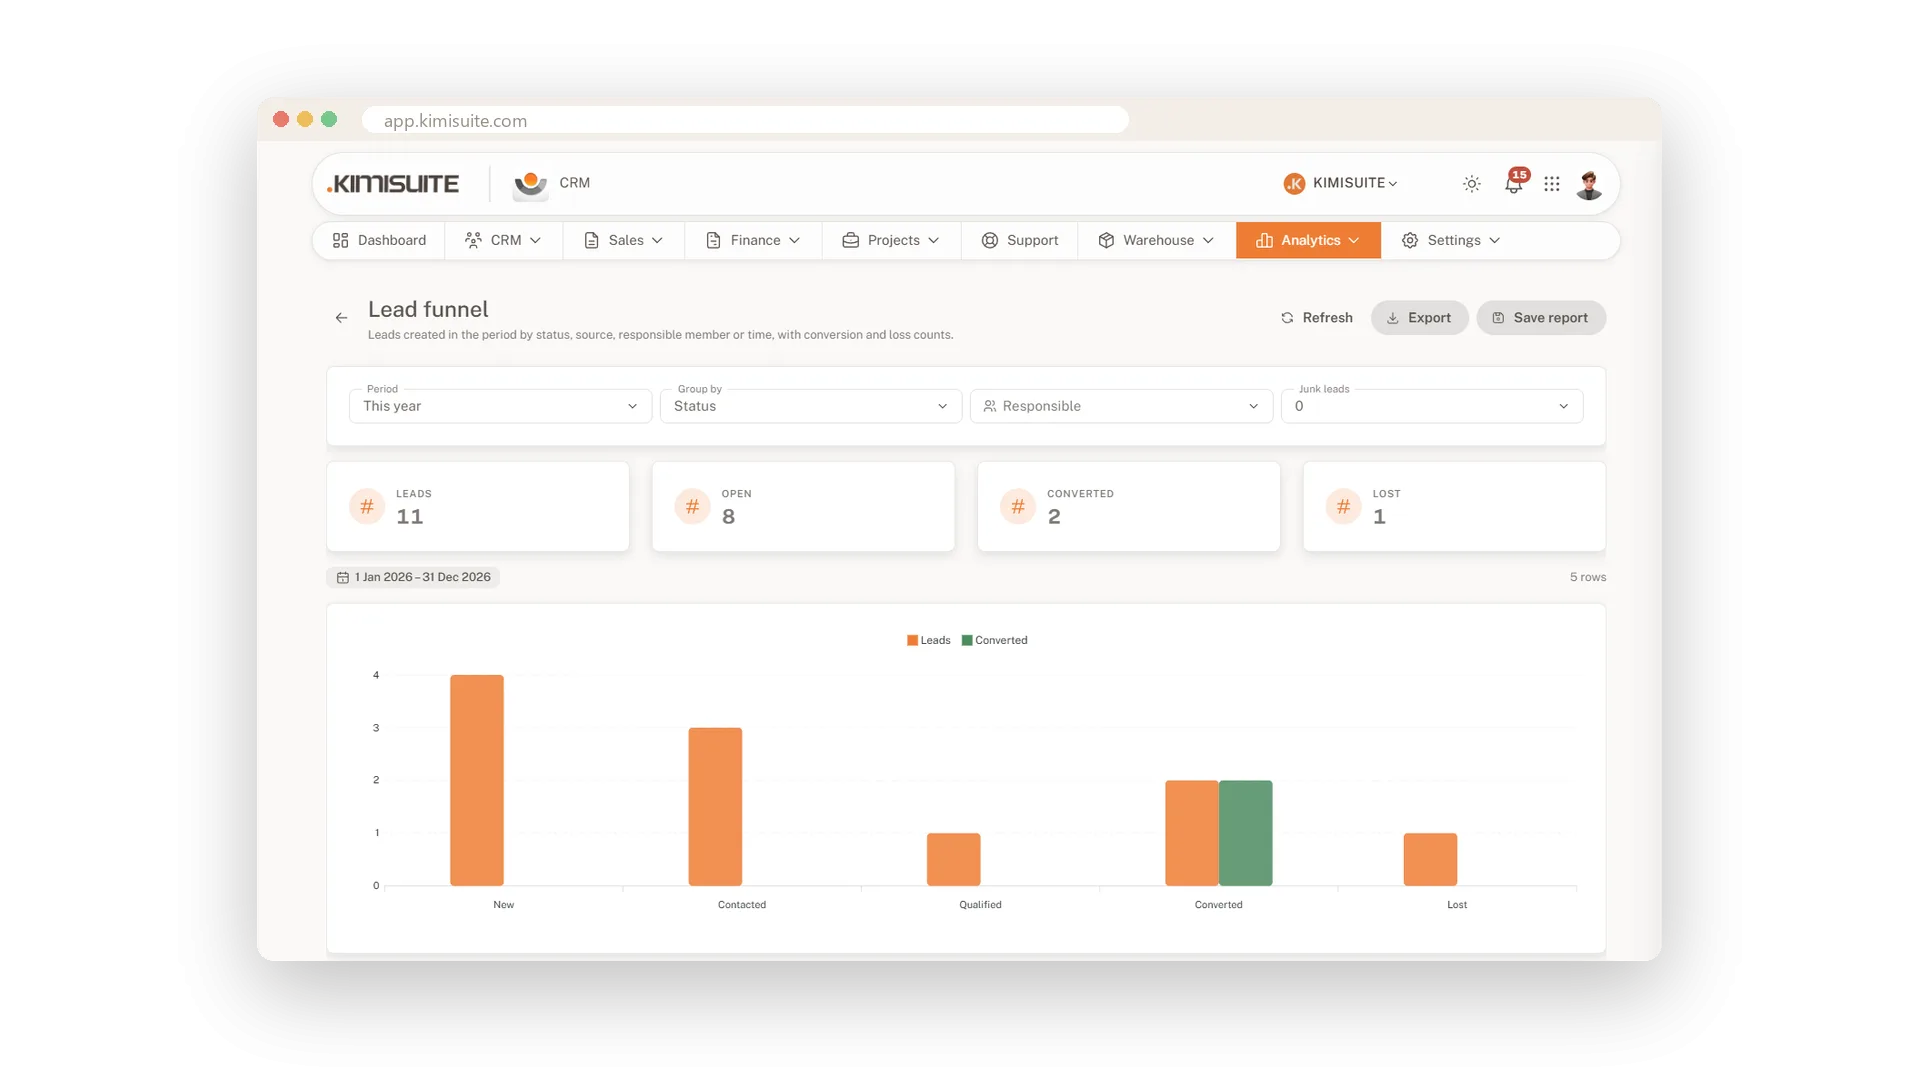
The lead funnel shows how your leads move from new to contacted, qualified and converted. Lead sources show which channels bring them in, and pipeline performance and the deal forecast show what is coming. Part of the lead and deal modules from Business.
Project profitability
See which projects earn money
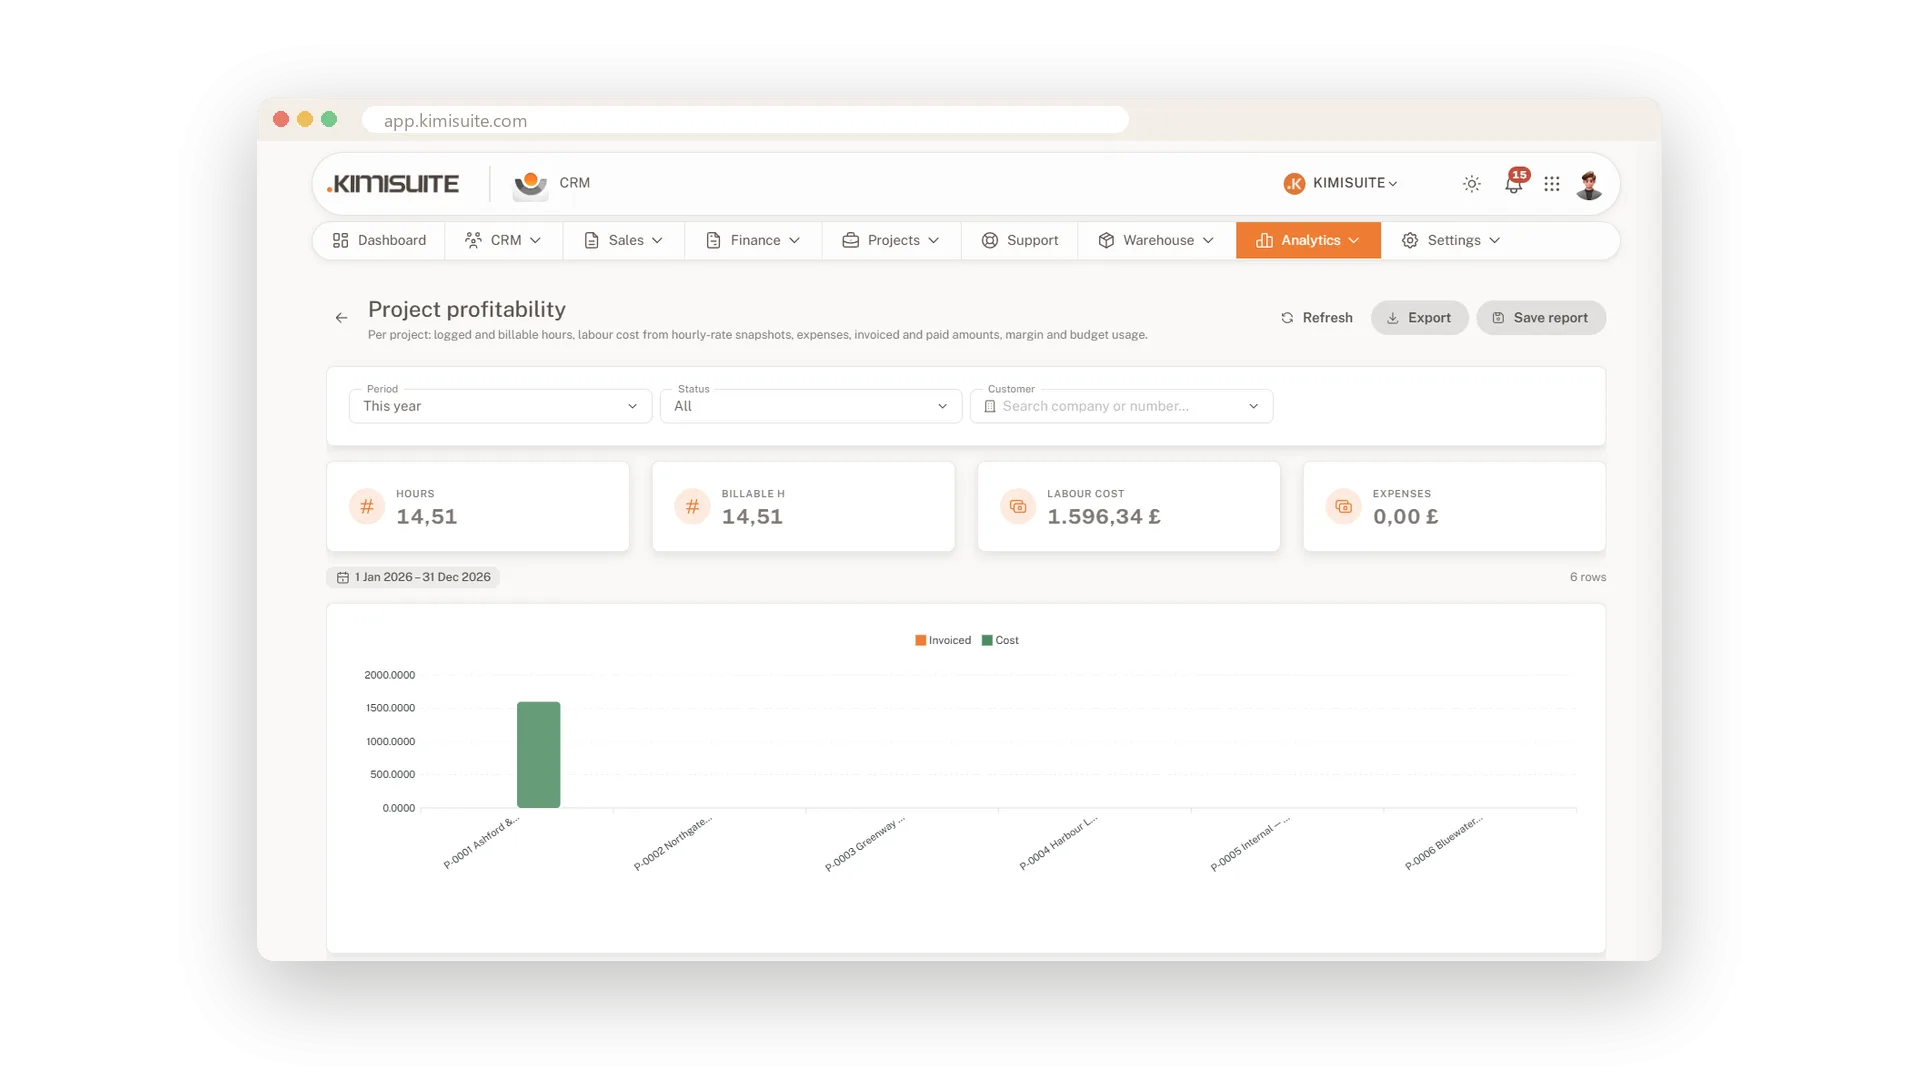
Hours, costs and invoiced amounts come together per project. You see which jobs paid off and which ate into the margin - in time to price the next one better.
Use Cases
Monday morning in five minutes
Open the dashboard and see what needs attention, the reminders that are due and six months of incoming payments. You know what to chase before the first coffee is finished.
Tax figures, ready for your accountant
Open the tax report, set the quarter and export it. Your accountant gets clean numbers instead of a pile of paper.
Figures that arrive by themselves
Build a report once in the report builder and schedule it. It lands in your inbox on the rhythm you chose, without anyone running it.
FAQ
Try CRM Business Hub today
From first lead to paid invoice in one app
14 days free, cancel anytime, no minimum term.