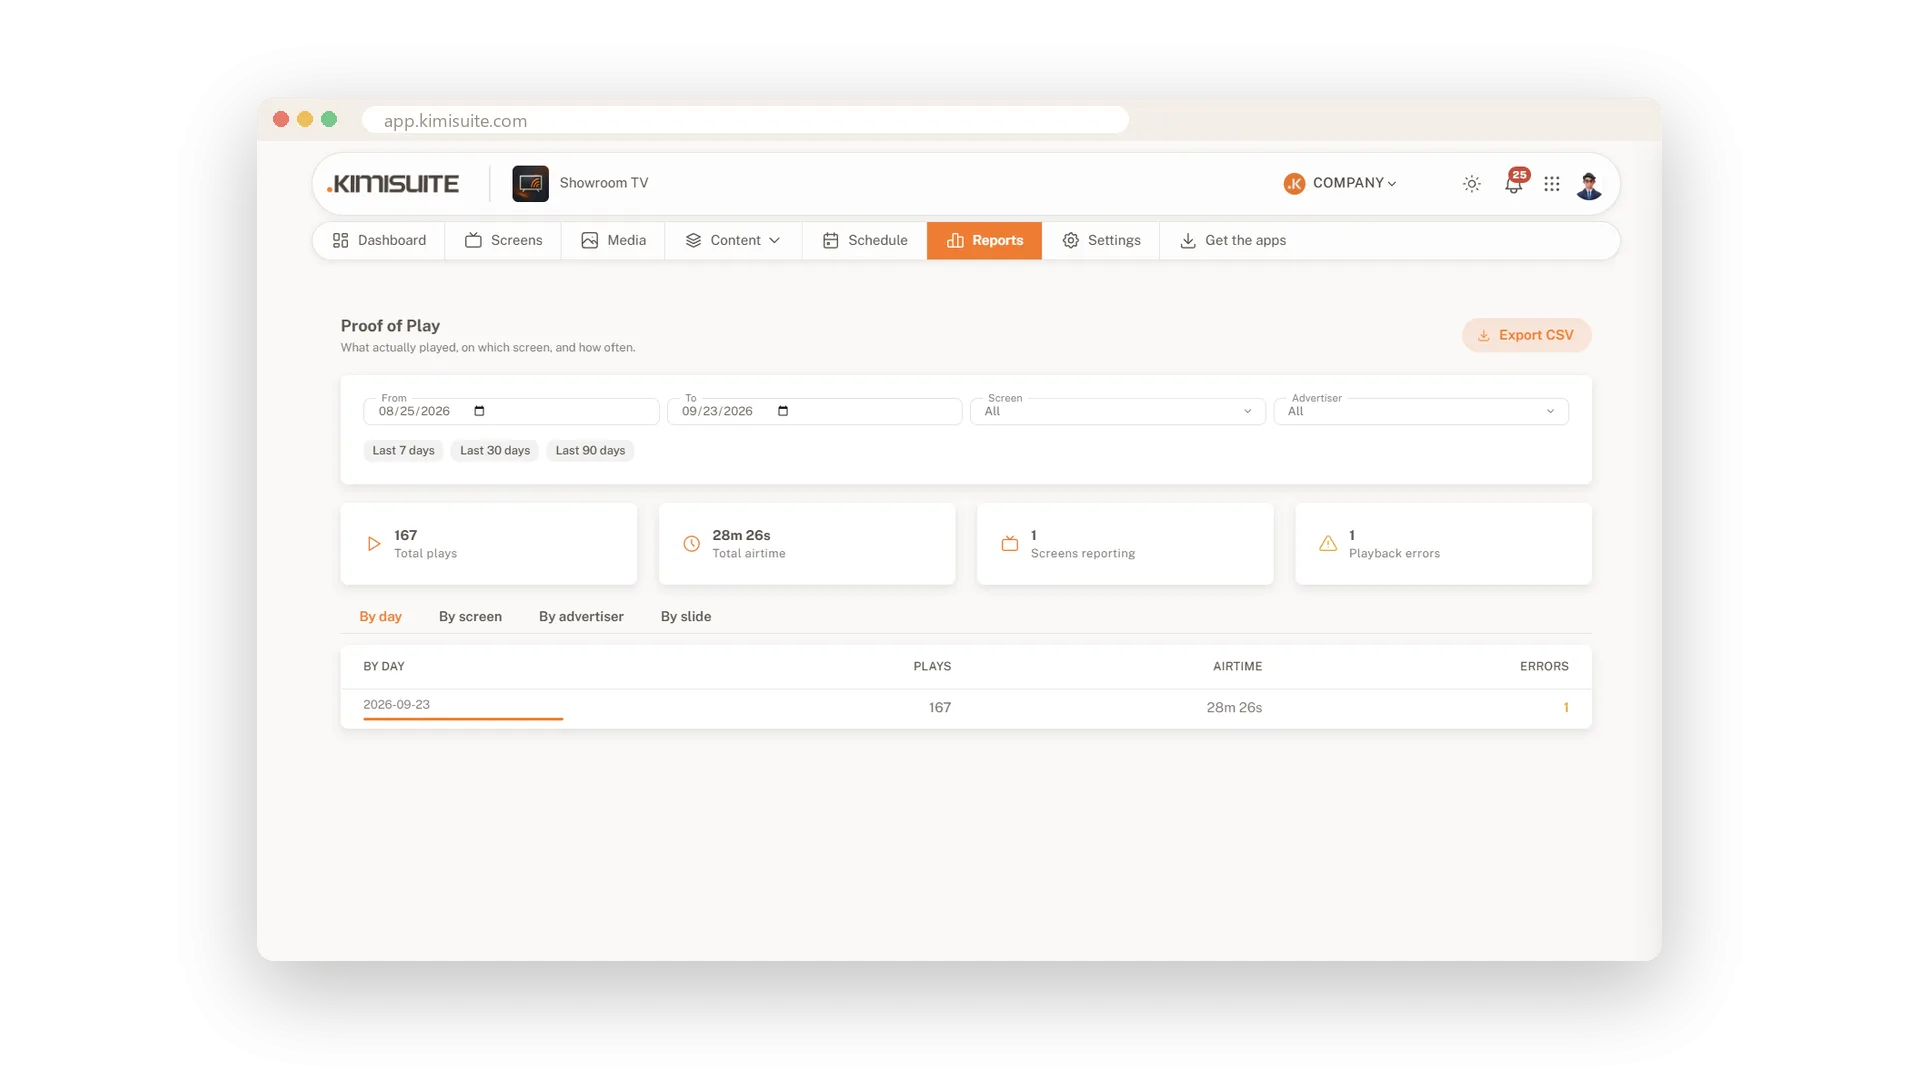
Knowing what should play is good; knowing what did play is better. The report counts every play and the airtime on each screen. You see which screens report and whether there were playback errors. It is the answer when a partner asks whether their offer really ran.
Choose the last 7, 30 or 90 days or any period, and filter by screen. The figures break down by day, by screen and by slide, with plays, airtime and errors in each row. Screens send their counters a few times an hour, so the report stays close to real time.
Key Benefits
Total plays, total airtime, reporting screens and playback errors at the top
Break the figures down by day, by screen or by slide
Last 7, 30 or 90 days, or any period you choose
Screens report their counters a few times an hour
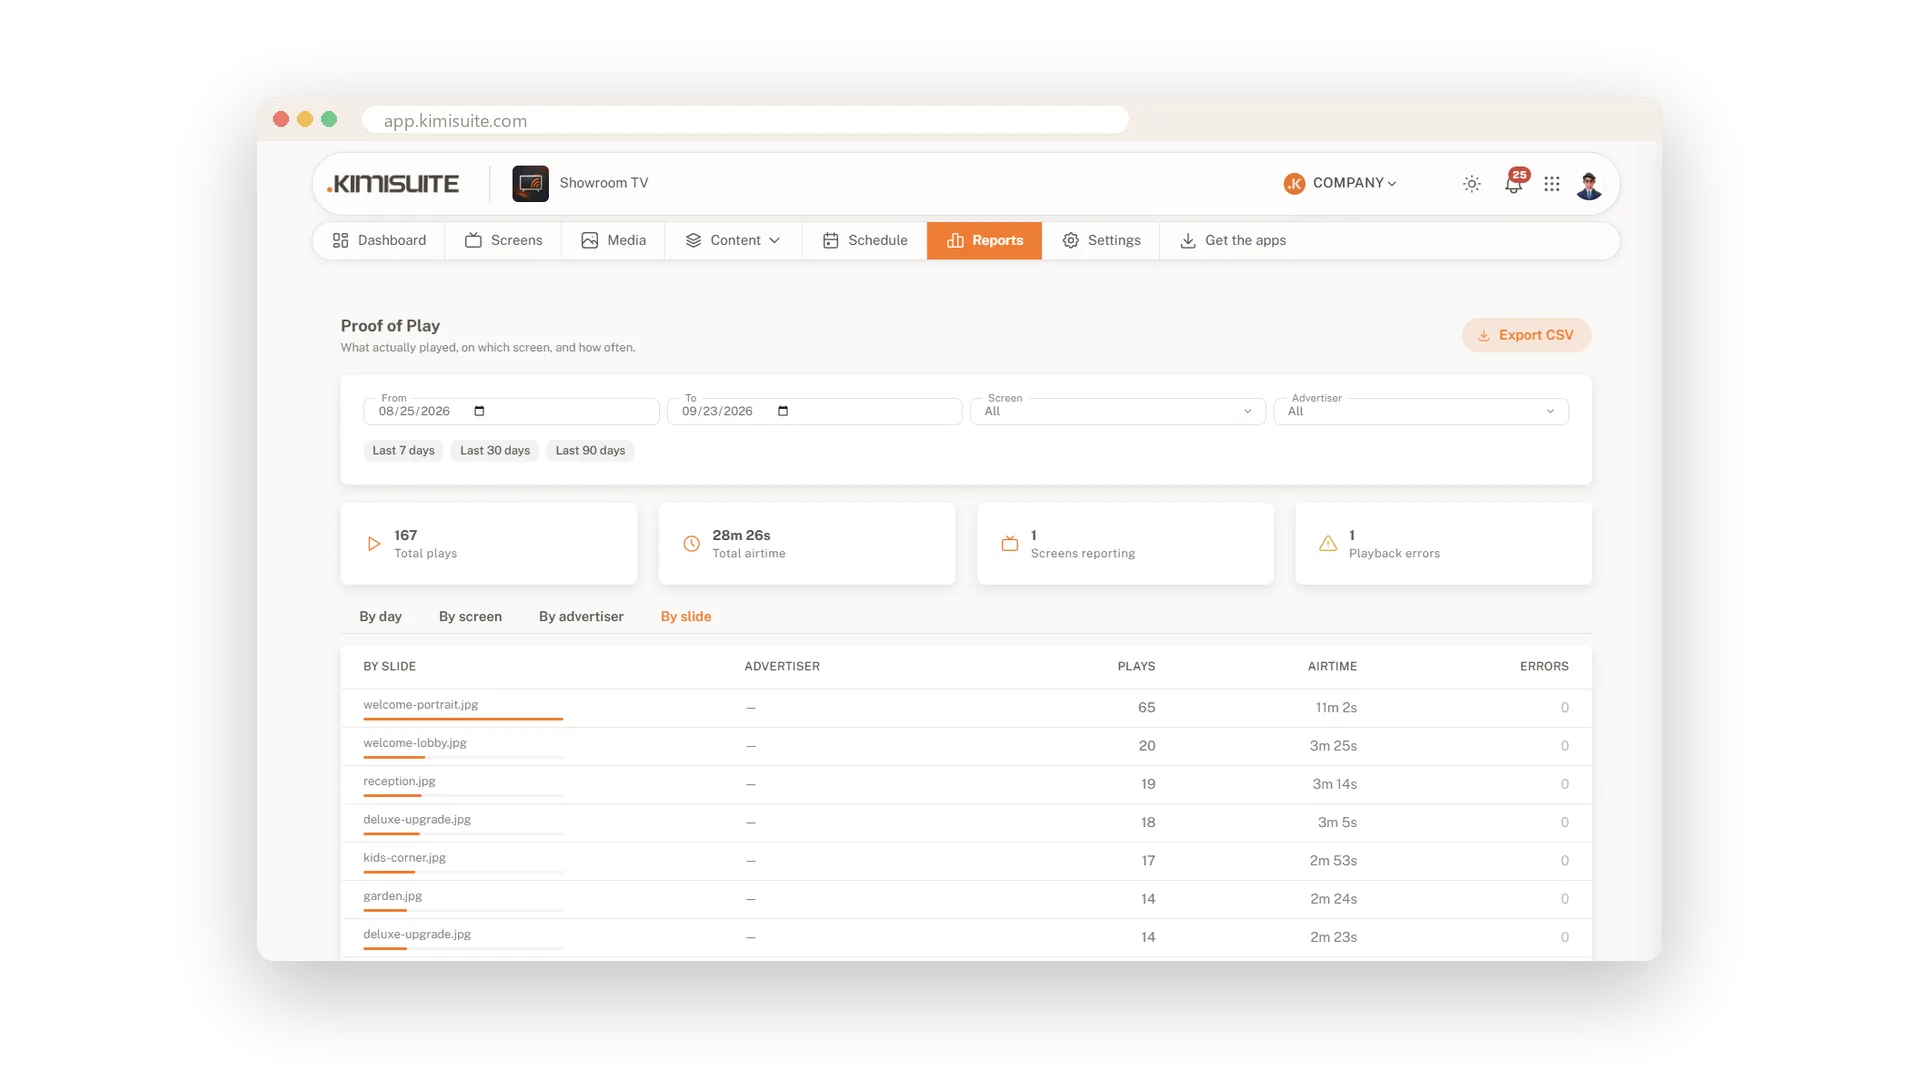
Plays and airtime for every slide
See which content really got screen time
Switch the report to By slide and every piece of content gets its own row with plays, airtime and errors. Compare it with By screen and By day to see where and when it ran.
Use Cases
The partner asks for numbers
A supplier wants to know how often their promotion ran last month. You open the report by slide and read plays and airtime.
A screen that plays too little
One screen shows far less airtime than the others. You find a gap in its schedule and fix it.
Errors caught early
The error count rises on one screen. You check it before customers see a blank display.
FAQ

Try Showroom TV today
Your offers on every TV, planned from your desk
14 days free, cancel anytime, no minimum term.